New Feature: Share your expertise and explain variances with data point annotations
Share This Blog

The fight against climate change is a team sport. We need to come together and combine our expertise if we want to stand a chance of making a dent in global carbon emissions.
When it comes to running energy efficient buildings, this couldn’t be more true. There are many stakeholders involved, who bring knowledge and expertise from a wide variety of perspectives.
Energy data alone doesn’t cut it. It very often calls for the context that relies on more anecdotal or subjective information that has been built up over many years and sits in areas of the business other than the sustainability team. The problem is this information is stored in notepads, emails, ticketing systems or even worse, inside people's heads.
That’s why we’ve built Data Point Annotations.
Our brand new feature is embedded throughout the platform and allows all users to add information about particular anomalies, outliers, events, variances or anything else worth sharing.
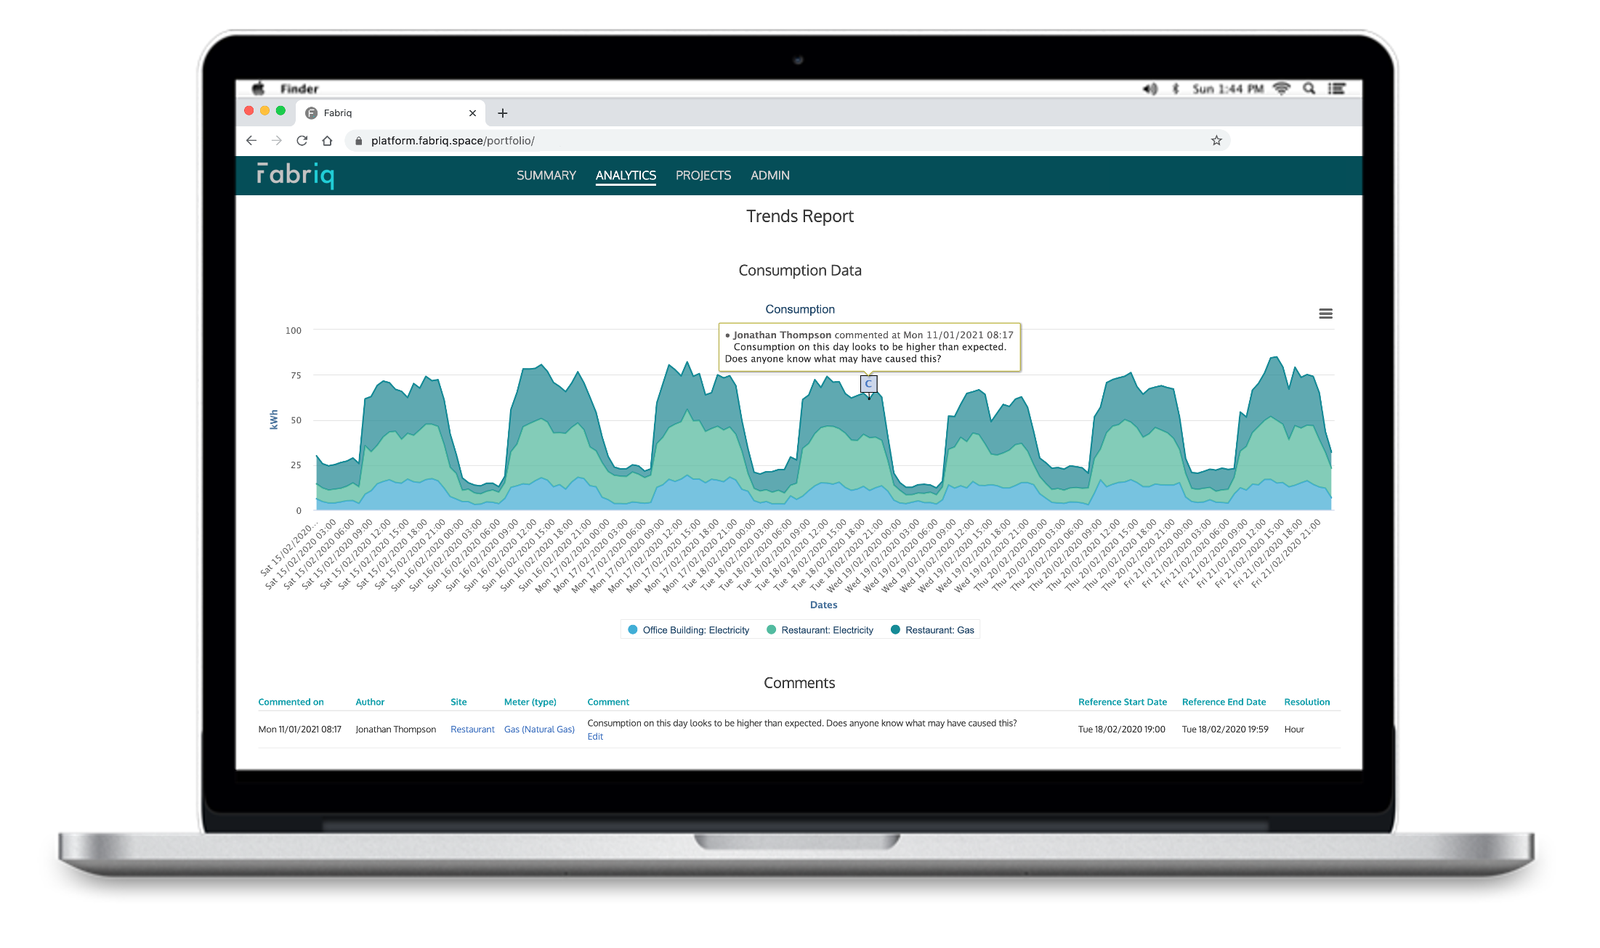
Explain Variances and Anomalies
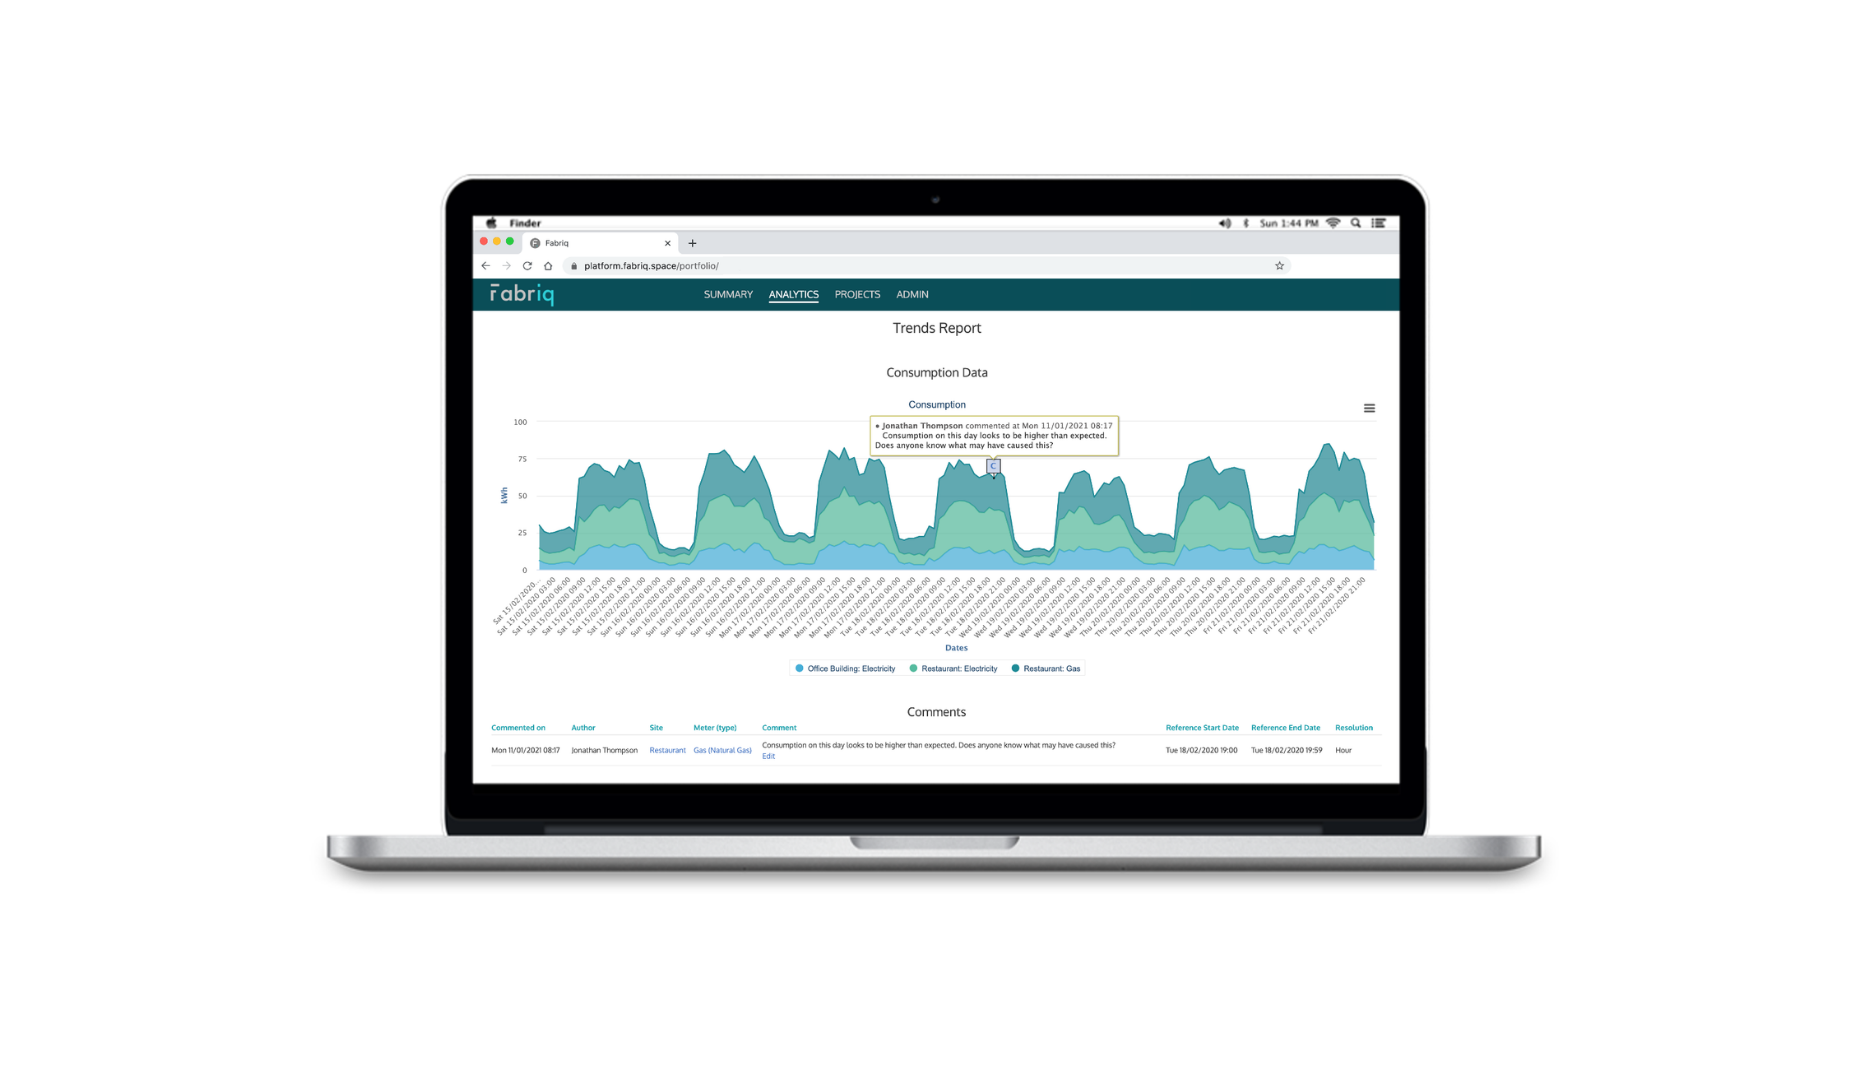
From within our Trend Analysis module, users can add annotations to data points at various resolutions to make sure the information is always relevant. If a comment is added when viewing data at monthly resolution that the comment will be applied to all data points in that month. However, users also have the option to add annotations to a single half hourly interval if they wish.
This is an opportunity for the facilities manager to make a note of the boiler being offline for maintenance or the events team to explain why the lighting ran until 01:00am on Wednesday for a late close. This information is essential for being able to reduce the noise and identify genuine issues worth investigating.
Add Context to Manual Data Uploads
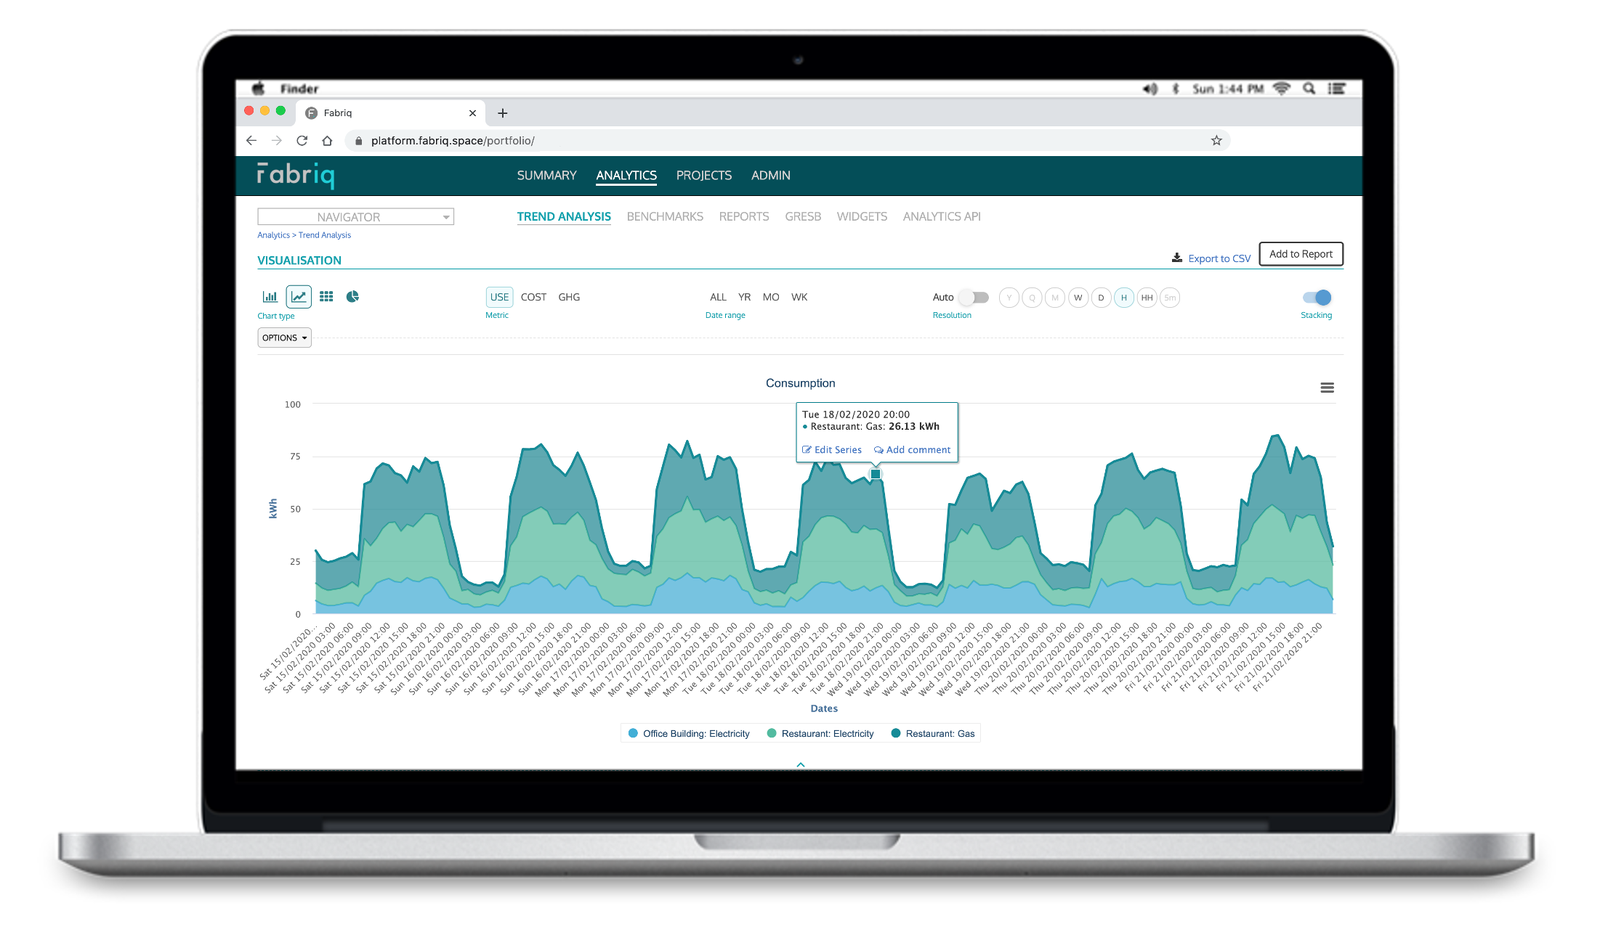
We understand how much of a pain uploading manual meter readings can be. But unfortunately, until we can crack the issue of automatic data collection across the board, they are a necessary evil.
One of the biggest challenges with manual meter readings is the reliability of the information that is made infinitely more difficult to interpret without any context. Users have always been able to add readings directly into the platform but now they can add a comment along with the reading that can go a long way to explaining any inconsistencies.
This is also an opportunity to explain any reasons why consumption may be higher or lower than expected that can be used in the analysis at a later point.
Any comments added at this stage are accessible to all users throughout the platform.
Distribute Annotations to all Stakeholders
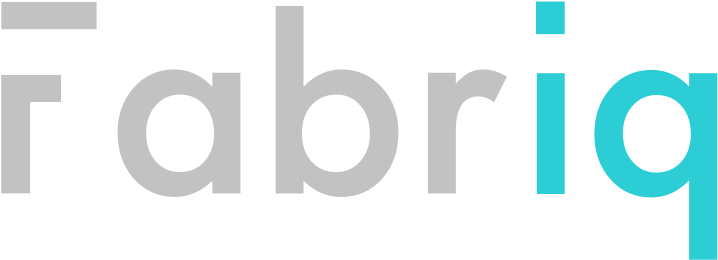
We wanted to ensure that any information that was added in the form of annotations was pushed to all corners of the platform.There are some stakeholders who receive most of their information through our scheduled reporting, rather than logging in to the platform itself.
For this reason, any annotations that are added to data points are appended to the relevant reports in table form and also as a tool tip in the chart itself. This means that if our users build a custom report that covers the period of a data point annotation, it will be added to the report itself.
Any future annotations that are added to that period will be automatically appended to the report before it’s automatically sent to the relevant stakeholders.
To find out how Data Point Annotations could help you scale your energy analytics or what other feature we have on offer, please get in touch!