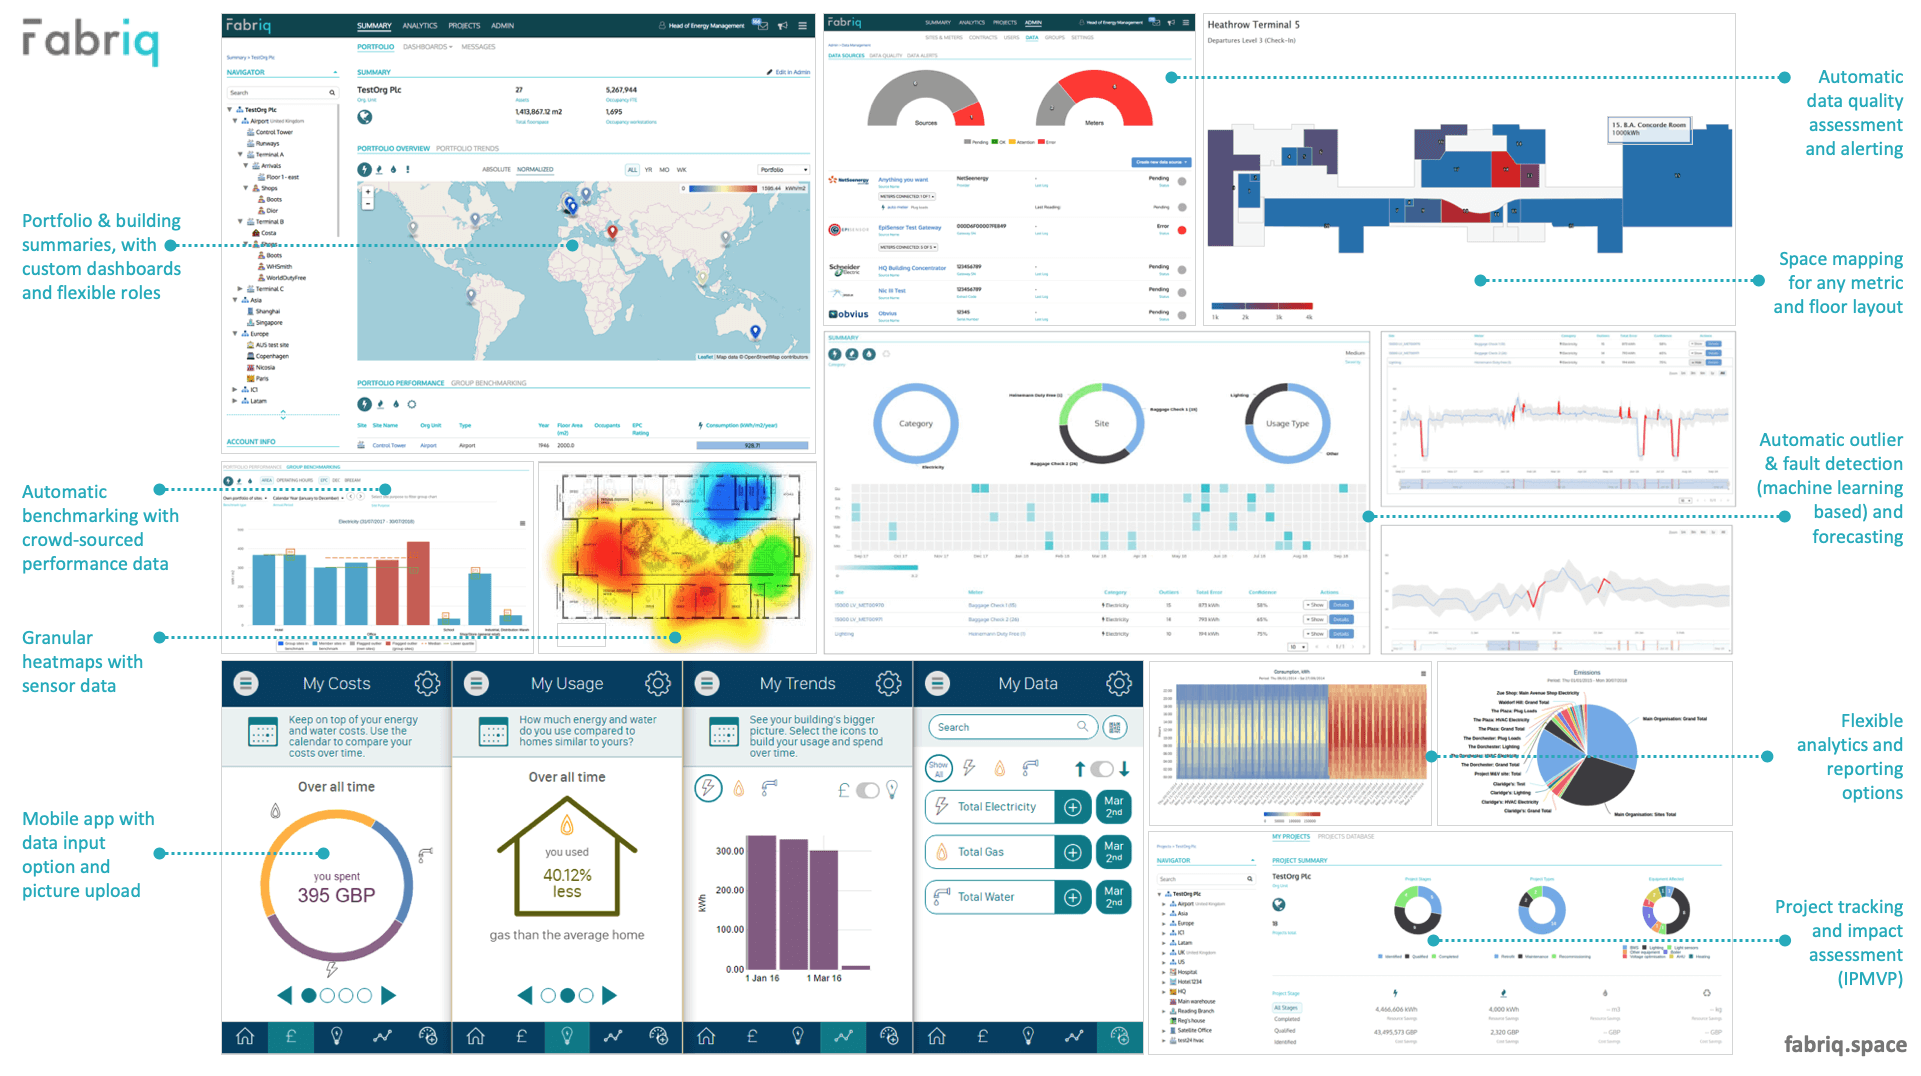
Access Fabriq from any web-connected device. Identify inefficiencies in your building operations and manage savings projects - not just for energy, but also water, waste, air quality, wellbeing, productivity and more.

One platform, any source, many apps

Fabriq is designed to be flexible and connect to a very wide range of building components, from metering gateways to building management systems and specialised sensors, e.g. for or air quality tracking and occupancy management.

On top of Fabriq OS - the platform layer - there are a range of apps (modules) which provide advanced functionality for users across the building operation “stack” - from landlords to tenants. The various capabilities are described in more detail in the list below.

GRESB reporting like a champ

The Fabriq OS GRESB module is linked directly with the GRESB portal via an API, allowing asset managers and asset owners to seriously expedite the GRESB-submission process and turning a sometimes challenging task into a stroll in the park.

Data housed within Fabriq OS can be used to calculate reportable figures automatically and even directly submit these figures to GRESB. No spreadsheets involved.

Your whole portfolio at a glance

Fabriq enables you to see your entire portfolio of assets in a single, highly informative dashboard. Showing building performance benchmarks, key asset information as well as alerts.

Fabriq manages more than just energy and you can track and visualise water, waste, travel, transportation and many other metrics, including custom ones.

Spatial analysis & data visualisation in Spacemaps

Spacemaps is a new module in Fabriq OS, which helps to visualise data and insights in new and intuitive ways for a wide range of users.

Make large complex sites like commercial offices, retail facilities or even airports instantly accessible for monitoring and spatial analysis. Because sometimes, a Spacemap says more than a thousand bar charts.

Detailed asset level information and tracking

Create floors, areas within floors and even rooms. Add as many data feeds as you like, ranging from energy and resource meters to e.g. air quality and occupancy sensors. You can even add building ratings, certifications and upload reports.

Once you’ve set the location of your sites, Fabriq will automatically import degree day and other relevant data such as carbon factors.

Meter mania - have your meters any which way

In the Fabriq platform, any data source is a “meter”. This includes actual meters such as the ones that track electricity, gas and water consumption (and of analog, digital or AMR type - we take them all), as well as on-site energy generation, e.g. through solar PV. In addition, metrics like waste, travel, transportation and occupancy are also tracked via meters in Fabriq; the same goes for environmental metrics such as occupancy, temperatures, air quality and so on. Last but not least, you can create virtual meters by combining existing meters in various proportions in Fabriq, and create target meters for almost any metric you track.

Advanced, automatic asset benchmarking

In Fabriq, asset performance benchmarking works out of the box, automatically. All sites (with floorspace provided) will be benchmarking against similar site types with the user’s portfolio and against the global Fabriq database. Benchmarking works for electricity, gas, water and waste metrics.

Users can select different reference systems for their benchmark beyond their own portfolio. This includes CIBSE TM46 as well as industry specific groups that are accessible via the platform.

Comprehensive, fully dynamic analytics

The Analytics module in Fabriq allows for a fully dynamic configuration of charts and reports. Select any configuration of assets, meters / sensors, environmental metrics, carbon factors and chart types. In addition, key functions like normalisations, year-on-year comparison, rolling average and targeting are already included.

Any charts generated can be pinned to the dashboard, used for reports or downloaded in spreadsheet format.

Deep energy analytics - regression, heatmapping and alerts

Need deeper energy analytics? Look no further. Fabriq provides regression analysis (for heating and cooling degree days), heatmapping (for any metric) and the possibility to configure flexible alerts.

In addition, Fabriq includes sophisticated and configurable summary tables which can also be included in reports or exported into Excel.

Flexible reporting - Online, PDF, DOC & GRESB

Almost any chart that can be generated in Fabriq can be added to reports. Our advanced Reports generator allows the user to change the order of report elements, annotate each chart separately, and update the reporting period.

Reports can be scheduled to run on specific days (and times) and be distributed automatically to users via email. In terms of outputs, reports can be generated in a range of formats including HTML, PDF and DOC. Fabriq also supports export to GRESB for annual sustainability reporting.

Sophisticated, real-time Data Quality analysis with alerting

With more than 50 data source integrations for Fabriq and several tens of thousands of live data feeds, we know a thing or two about data quality (and a lot more things about what can go wrong with automated data sources).

Which is why we’ve built a full Data Quality module that automagically keeps track of all your connected data sources, telling you when a source or meter connection goes down, or Fabriq doesn’t receive the expected number of readings (at the expected time) and so on. All of the DQ events can be configured into alerts.

Air quality monitoring for WELL and RESET

Air quality monitoring - both indoors and outdoors - is becoming increasingly important in urban centres today. We provide a dedicated air quality monitoring module that allows to track CO2, PM (particulate matter), VOC, humidity and temperature, to name but a few supported metrics.

Air quality is then visualised in form of dials for instant readings. Charts can be configured to show readings for the past 24 hours or 7 days, including minimum and maximum values.

This is particularly useful for emerging schemes like WELL, RESET and Fitwel, all of which have a strong focus on ongoing monitoring of indoor work spaces.

Integrated M&V capability to measure the impact of savings measures

Fabriq provides an integrated M&V (measurement and verification) capability that allows users to automatically validate the impact of a range of savings measures on the asset performance. Examples for this include voltage optimisation, a new lighting system, or recommissioning of an HVAC unit.

To calculate the normalised before / after performance of the asset, any environmental variable can be used. This includes heating and cooling degree days but also occupancy, temperatures, daylight hours and so on. The only limit lies in the type of variables available for the site (users can upload custom metrics).

Granular user management and community groups

As everyone knows, sharing is caring. So we’ve made it easy to do just that - via a highly granular user management capability. Create new users simply by adding their email, then configure their access rights by allocating standard roles and specific assets to them.

User create their own account and can be managed centrally by the organisation administrator.

In addition, users can sign up to community groups which give them access to anonymised benchmarks for the group. This is useful for community engagement programmes as well as the automatic creation of industry specific benchmarks (say, retailers in the UK or global airports).

Mobile access from any web-connected device

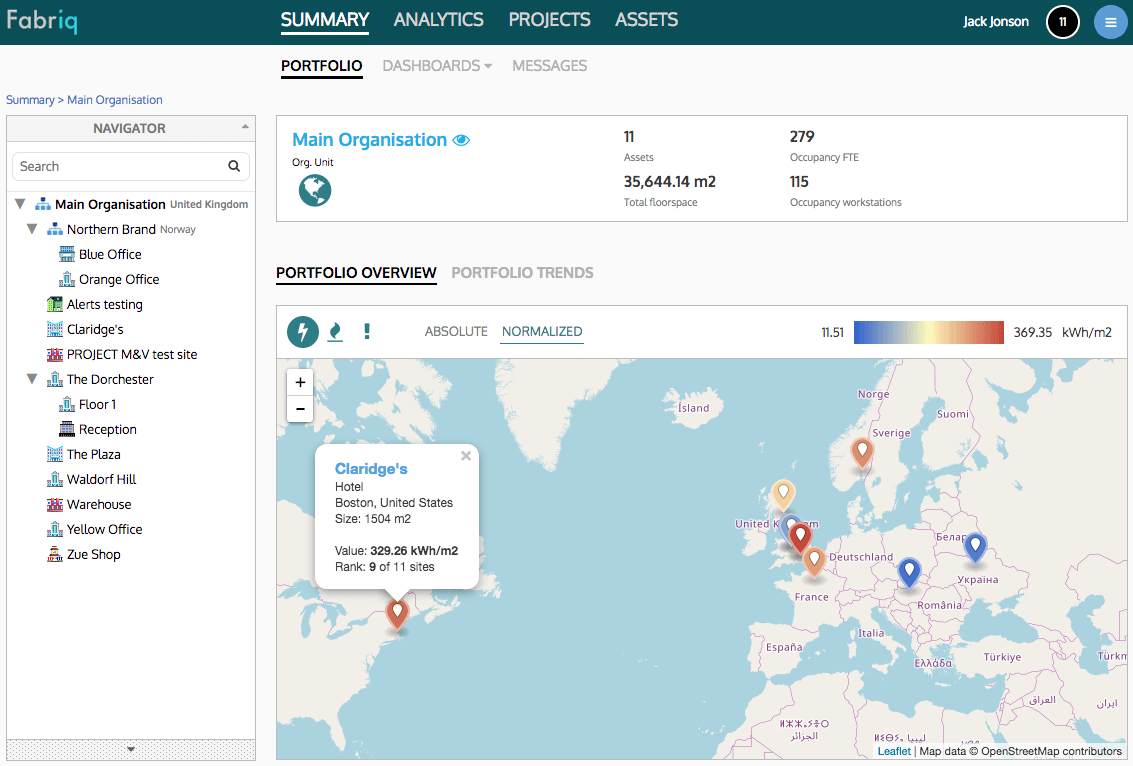
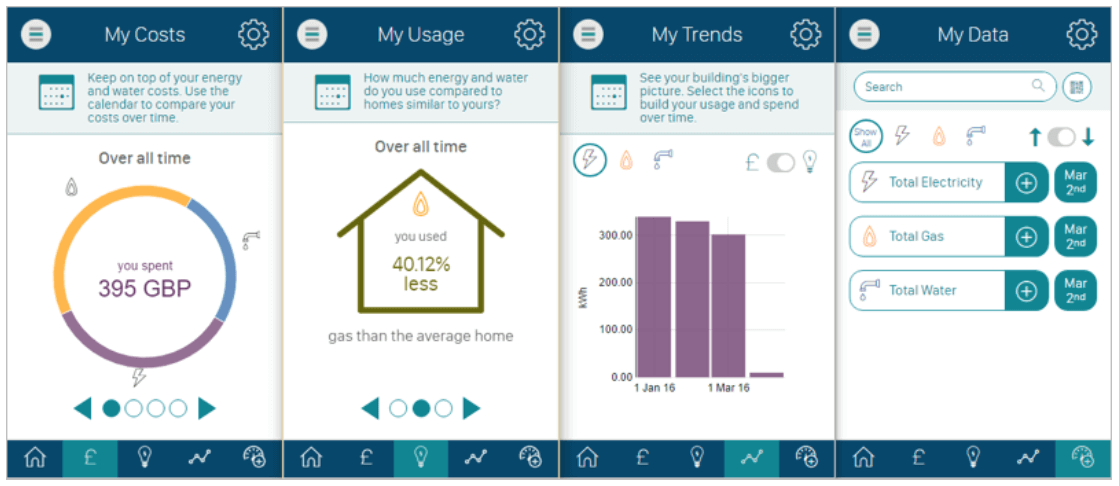
The mobile app provides access to a simplified and streamlined version of the platform from any internet connected device, including any smartphone or tablet (via the built-in browser). The app provides key information at asset level on cost, performance (benchmark) and even trend based consumption or cost data.

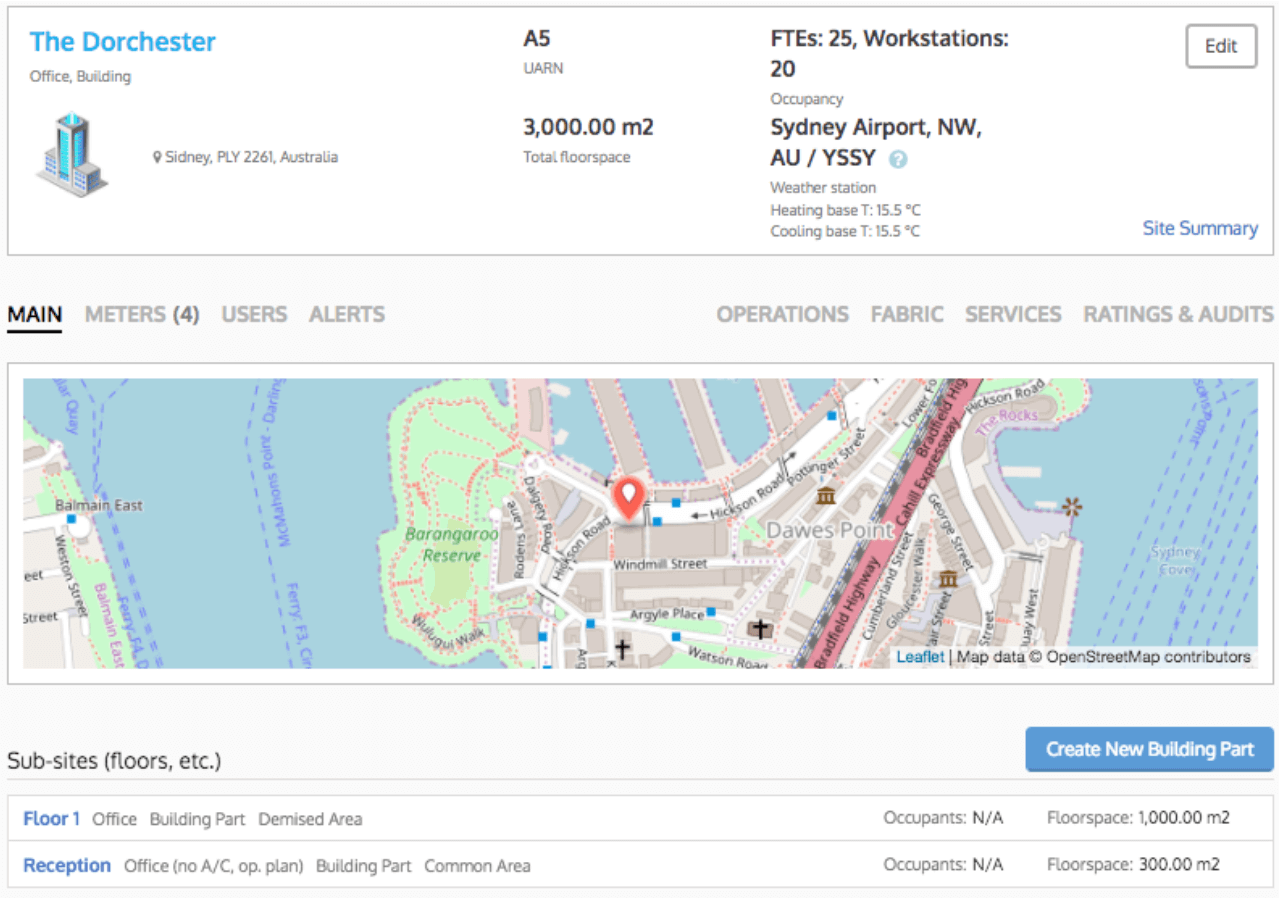
In addition, it is possible to enter consumption data directly via the app. Not only this, but users can upload images of e.g. electricity meters that they’ve taken with the device’s camera directly to the platform for reference. The app even makes it possible to scan the meter barcode and filter the integrated meter list accordingly.