Fabriq OS update: More ways to put your building operations data to use
Share This Blog

Contextualise energy consumption throughout Fabriq OS with a comprehensive inventory of site characteristics.
Fabriq has always been about much more than just energy data. We believe that energy data alone fails to provide enough information on which to build meaningful insights. It’s crucial to understand much more about a building in order to identify waste and improve performance over the long term.
For this reason, we’ve always encouraged our users to collect all the supplementary data they can get their hand on. By building custom integrations we’ve tried to make the process as straightforward as possible.
In the past, floor area has been the go-to metric for normalising and comparing building energy consumption. Typically in the form of kWh / m2 or ft2. It’s what underpins industry benchmarking systems such as CIBSE and TM46.
The Net Zero Carbon movement has placed more emphasis on metrics that accurately reflect building performance. It’s no longer good enough to use floor area as a “ballpark” metric. We need to make a concerted effort to understand building performance at a deeper level. This involves segmenting portfolios to discover what is driving differences in performance between sites and where the similarities lie.
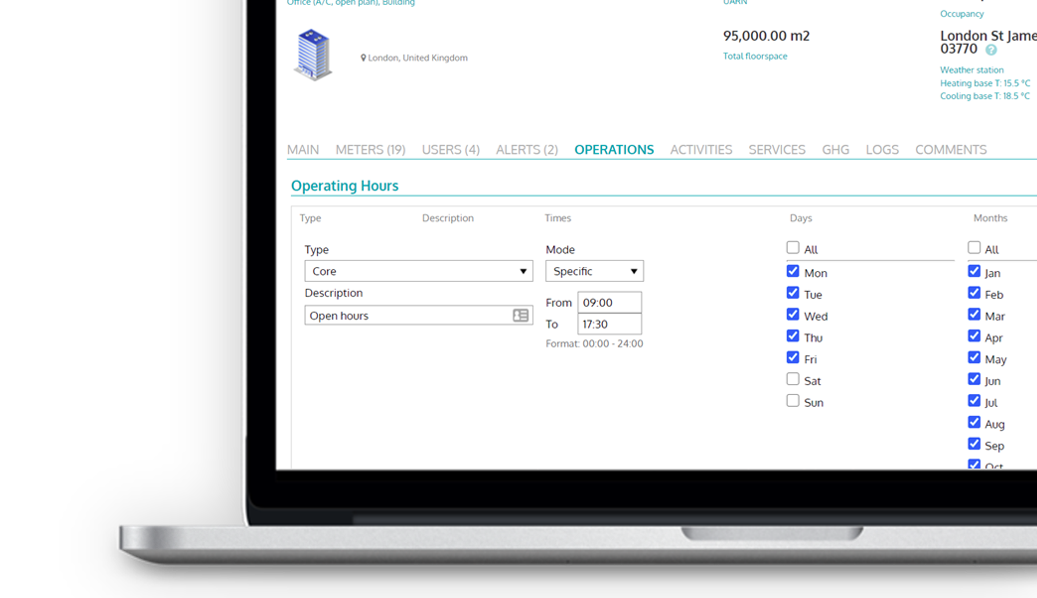
Introducing Support for Additional Site Operations Metrics
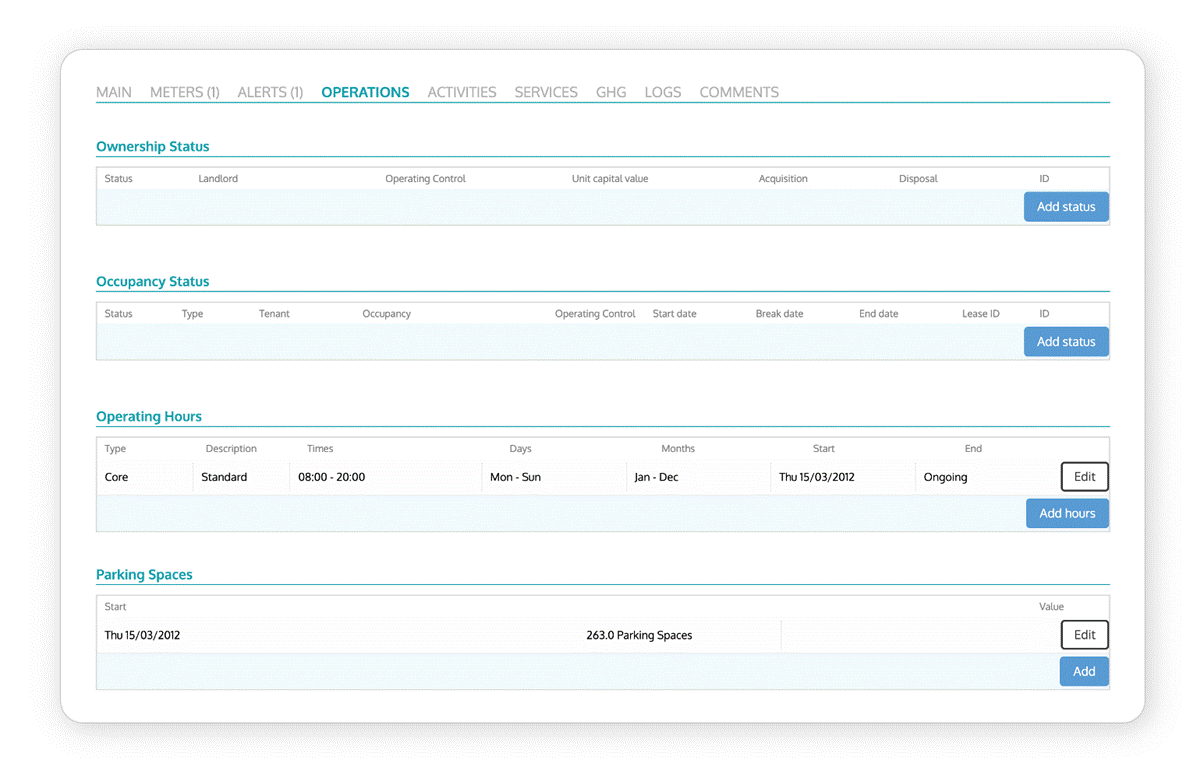
In addition to the standard set of operations that have always been available in Fabriq, there are now sector specific options that can be added on a site by site basis. Number of rooms for the hotel industry, tables or covers for hospitality and number of seats for sporting events are just a few we’ve already added as standard. We’ve built the back end out so that user requests can be added and visible in the platform in a matter of minutes. Future functionality will enable users to add their own operations categories to the platform.
There’s an obvious advantage to being able to store additional information against a site but that’s just the beginning. Each operation, or site characteristic, can then be utilised throughout the platform, meaning Fabriq’s core functionality is now even more relevant to a wide range of sectors and building types.
Trend Analysis
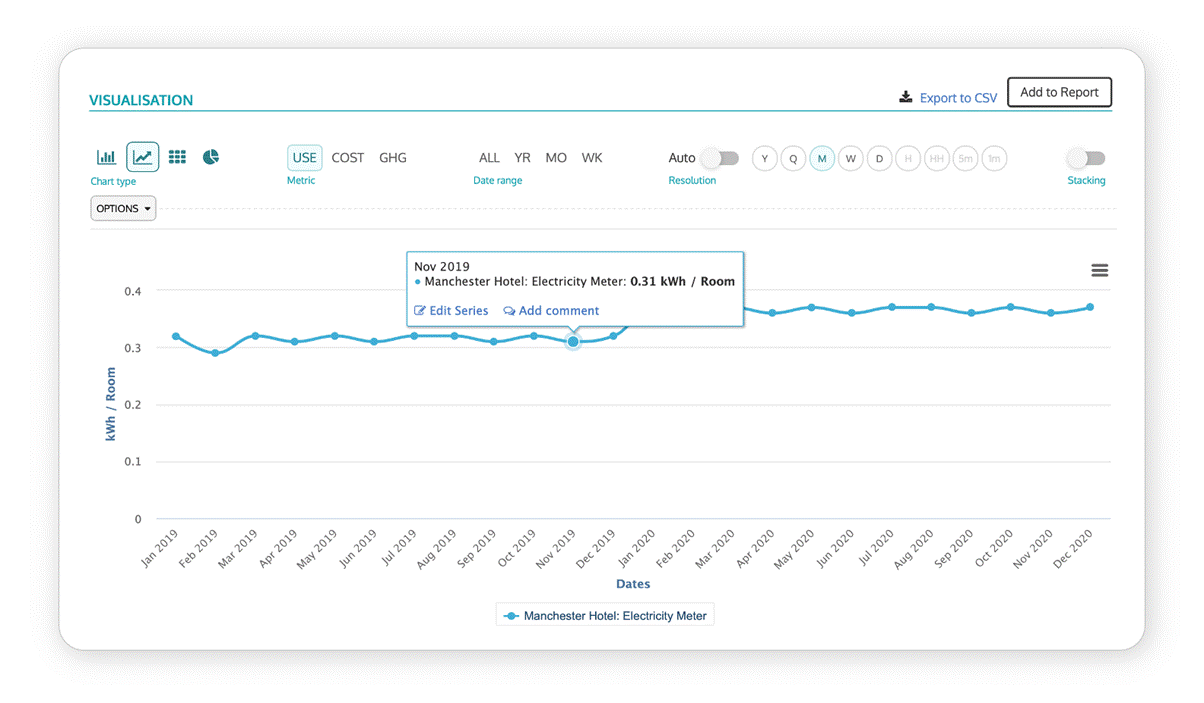
The example above shows how the number of rooms can be used to normalise energy consumption for a hotel. This is a great example of when floor area isn’t specific enough and won’t generate the insights our users need. By adding the number of rooms to each site, the data has suddenly become much more interesting.
If for whatever reason the number of rooms was to increase, perhaps due to an extension, this can be logged in Fabriq. With the number of rooms stored chronologically, users can analyse the impact of the extension whilst simultaneously maintaining a consistent view of building performance through the normalised values over the entire period.
Benchmarking
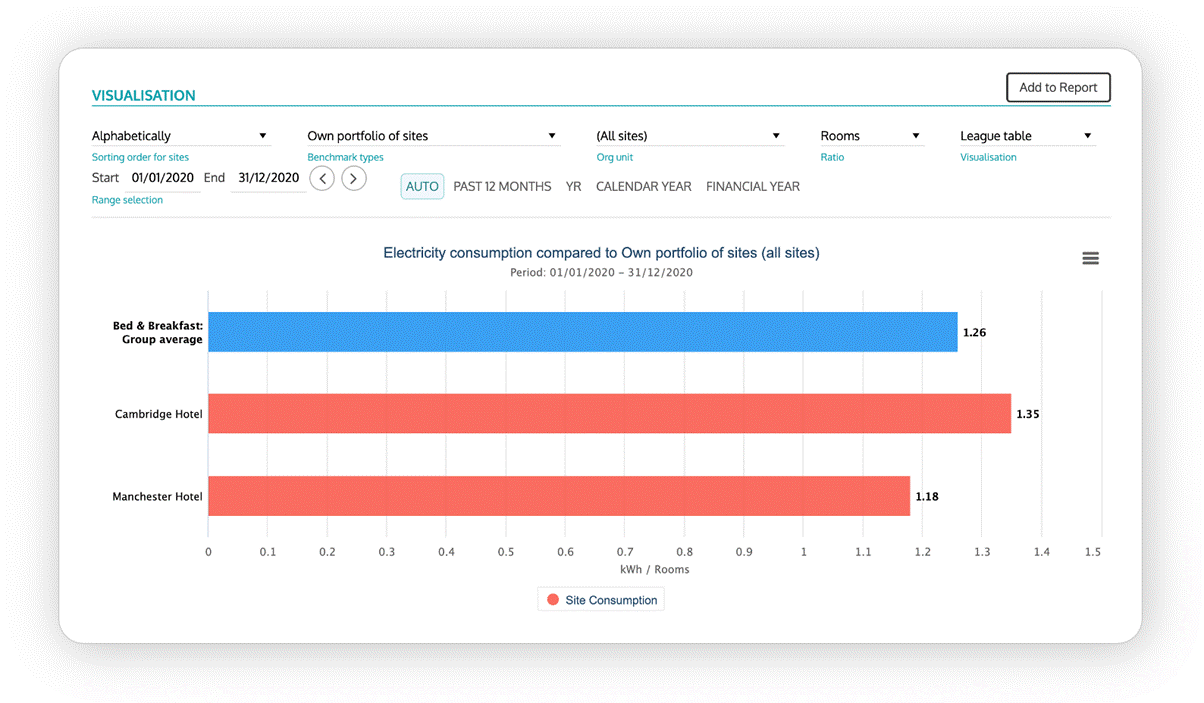
There’s nothing quite like portfolio wide benchmarking for assessing building performance at scale. By normalising consumption and zooming out to a portfolio or even better, a multi-portfolio level view, our users are able to identify buildings with a relatively high energy intensity.
Fabriq users can now benchmark portfolios by the extended list of operations and site characteristics, enabling them to reduce the noise and generate meaningful insights.
Alerts
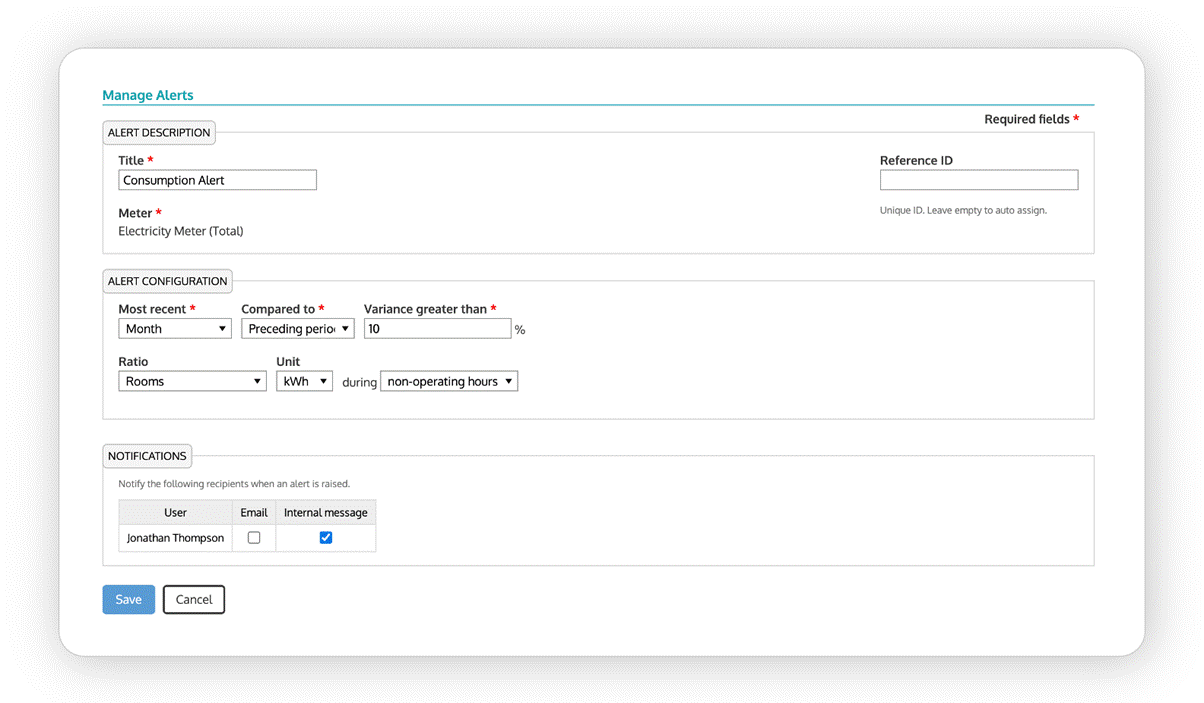
Last but by no means least, an extended list of site operations has transformed the way users can set up alerts in Fabriq. Establishing threshold values can be difficult across large portfolios, particularly when consumption varies greatly site to site. A normalised value that remains relevant across all sites makes things a lot easier. Users have always been able to set alerts on a kWh / x basis but the list of options available has now been extended to all site operations.
Let’s go back to the hotel example for a second. Setting a weekly alert threshold at 30kWh per room across all sites is a lot more straightforward than site specific thresholds. It also makes threshold breaches more comparable and easier to explain.
Get in touch if you want to learn how to leverage operations data and take your energy data analysis to the next level!