
We've gone "frameless"! And other updates from the platform
Share This Blog

Hot on the heels of the major Fabriq update in February we've just launched a UI upgrade and a range of new features in Fabriq OS. These include improved site level views featuring benchmarks and alert summaries. In addition, we've now merged Carbon Footprinting into Trend Analysis, which not only makes tracking more efficient, but also enables the visualisation of different metrics in the same Analytics chart.
1. Frameless UI design
It's official - we've gone frameless! We've done away with any boxes (frames) and the light grey background, in order to focus on what really matters: make the most of your building as well as project data through a UI that is beautiful, clean and easy to use, and gets out of the way as much as possible.
The new Fabriq UI features a spanking white background, the Fabriq trademark shade of turquoise for section headers and feature labels and other than that - nothing but your portfolio data rendered in the most beautiful charts. We feel that this is what next generation energy and resource management should look like. In addition, it allows us to more flexibly add new functionality and content in the future. Stay tuned!
2. Improved site level views with integrated benchmarks and tracking of alerts
As part of the Frameless upgrade, the site-level views in the SUMMARY module have been improved to provide you with more useful information at your fingertips. You can now see a row of benchmarks shown in the form of doughnut charts right underneath the site summary. These charts provide insights into the relative performance of the selected site in terms of electricity, gas, water and waste consumption, as well as the site's ranking within the portfolio.
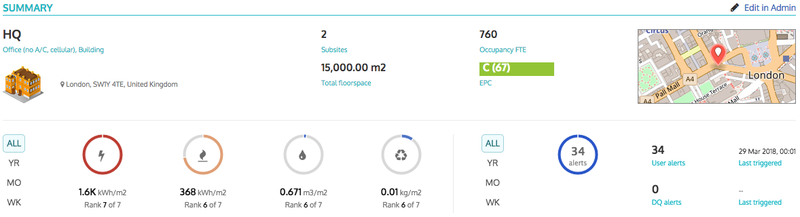
If you have alerts set up, the summary will also show a count of alerts generated, split into user alerts and data quality alerts for any connected automatic metering sources. Both sections can be set to show the information over all time for which there is data available (ALL), or alternatively the most recent year, month or week (YR, MO, WK respectively).
3. Carbon Footprinting merged into Trend Analysis, with collateral benefits
In the past, users had access to the full carbon footprinting functionality in a separate tab in ANALYTICS, allowing them to produce pie charts for carbon emissions by resource type or GHG scope. We've now merged this capability into the Trend Analysis tab, which previously already offered limited CO2 conversion options but not the full range of footprinting options.
This makes use of the ANALYTICS module more streamlined and effective, and has a very important collateral benefit: you can now select multiple resource types in the Navigator to be shown in the same chart, even when not in "carbon mode". For instance, it is now possible to visualise electricity AND gas in the same consumption chart (as they are both tracked in kWh). In addition, you have access to the full range of chart options for carbon and cost analytics, including e.g. heatmaps.
Note that to be able to view different resource types in the same chart, they have to be in the same unit, e.g. kWh, m3 etc.