
Summer Updates – Three big and exciting improvements made to Fabriq OS that will help you to manage your buildings’ performance
Share This Blog

We are excited to announce some of the improvements which have been made to Fabriq OS over the past few months in order to optimise your ability to pro-actively monitor every dimension of a building site’s environmental performance.
(1) Introducing ‘operating hours analytics’
A recent improvement to the platform is the new ability to utilise operating hours data. The new version of Fabriq OS allows for detailed analytics and visualisations of energy consumed during operating and non-operating hours. Within the ‘Analytics’ module, operating hours can now be overlaid to provide clear displays, illustrating consumption levels relative to operational status.
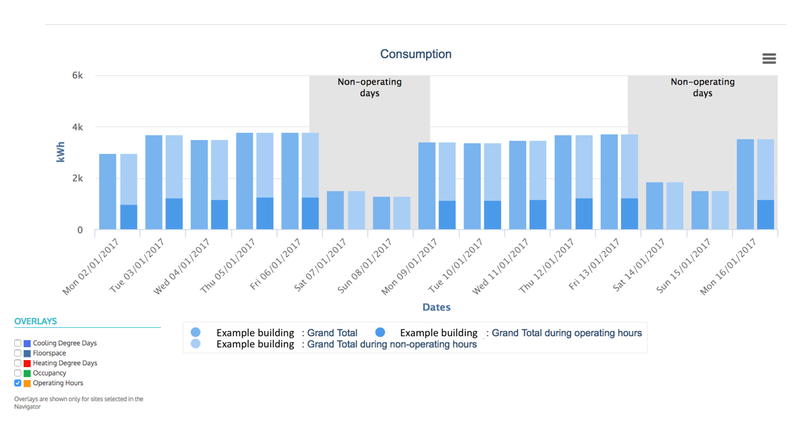
By stacking operating and non-operating consumption data, a base-load consumption figure can to be easily determined. This ultimately allows for a more developed understanding of how a building operates when it is not in full use, in comparison to when it is expected to be in active use, which in turn should translate into insights on sites to target for efficiency improvements.
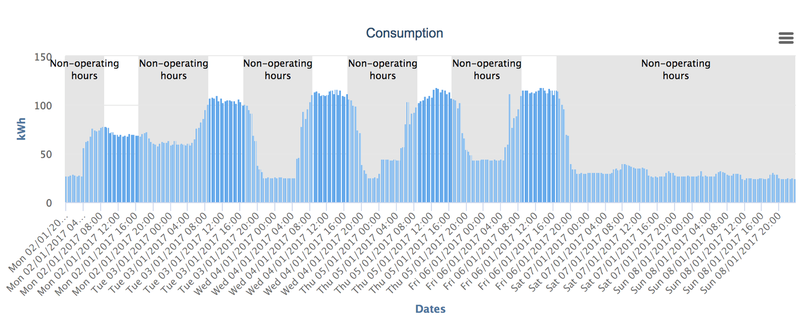
When looking at the data at a more granular resolution, in this instance half-hourly resolution, the overlay of operating hours enables a detailed look at how energy consumption differs and transitions between changes in the building’s operational status.
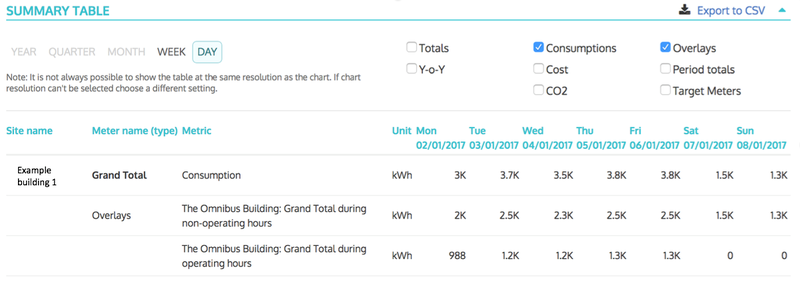
Additionally, a detailed summary table is now available, quantifying energy consumption during operating and non-operating hours. Both tables and graphs can easily be exported in a variety of file formats.
In addition to these upgrades, it is now possible to normalise data against operating hours and define during which operational status alerts should trigger (operating/ non-operating or all).
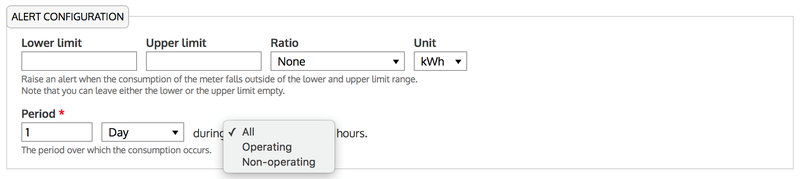
This should allow more targeted and granular alerts to be set for any site.
(2) Alerts Workflow – easily manage and track alerts which have been triggered
Triggered alerts can now be efficiently managed and tracked with a dedicated module. This management tool enables effective prioritisation of alerts, whilst each part of an alert’s investigation can be logged and status updates provided up until a resolution is achieved.
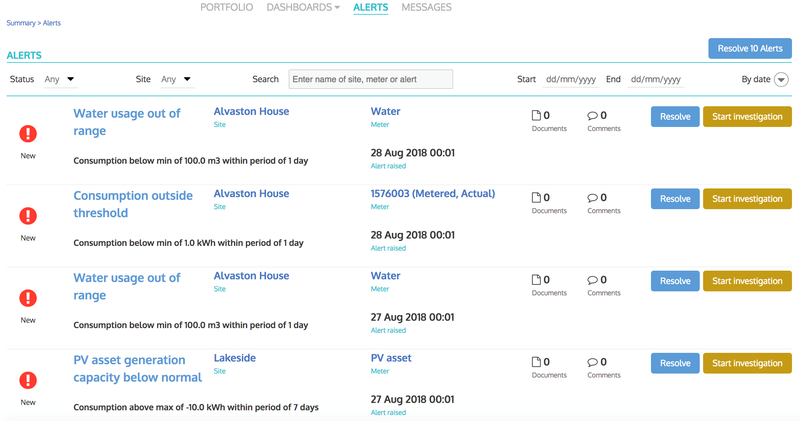
It is also now possible to interrogate data concerning an alert to identify the exact point at which the threshold was surpassed, enabling users to adopt a proactive approach to intervene when potential issues arise and bring consumption levels back within the expected range.
The new update also allows users to upload supporting documentation relating to alerts which have been triggered.
(3) EPC Benchmarking – an easy way to compare site performance
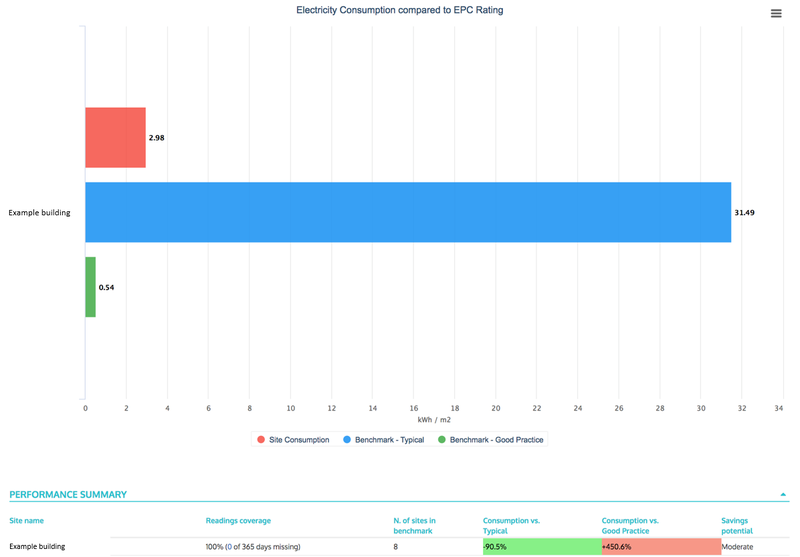
With the new addition of EPC ratings to the benchmark module, it is now possible to compare site performance against other sites within the same EPC band, in addition to making comparisons to ‘good practice’ for defined site purposes.
The performance summary at the bottom of the page makes the analysis of this data even easier. It shows how a site’s consumption compares to that of a ‘typical site’ and that of a ‘good practice’ site, whilst also highlighting the scope for potential savings at the site in question.