Spatial Analysis with Spacemaps: Adding the “Where” to Data Visualisation in Buildings
Share This Blog
Spacemaps is a new module in Fabriq OS, which helps to visualise data and insights of real estate assets in new and intuitive ways for a wide range of users.
The Case for Data Visualisation in Buildings
In his book ‘Information Visualisation’, Colin Ware states: “The eye and the visual cortex of the brain form a massive parallel processor that provides the highest-bandwidth channel into human cognitive centres.” This explains why the human visual system can effectively process more information than all other senses combined. Plus, visuals can be deciphered by the brain much quicker than written information.
So, when analysing thousands of data points from hundreds of data sources such as meters or sensors in multiple buildings, like many of our clients do on an everyday basis, the importance of meaningful data visualisation is quite clear.
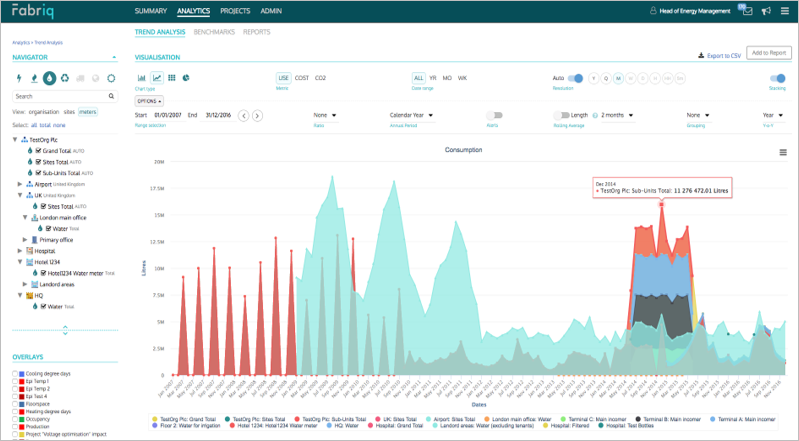
As a platform, Fabriq OS has been providing powerful and attractive visualisation options to users ever since the early days in 2012. The Analytics module in Fabriq OS gives users the opportunity to configure their reports in a wide variety of chart types - including bars, lines, heatmaps, scatter plots and so on - through a fully dynamic and highly responsive interface.
Spatial Analysis with Spacemaps - Gaining Insights from the “Where”
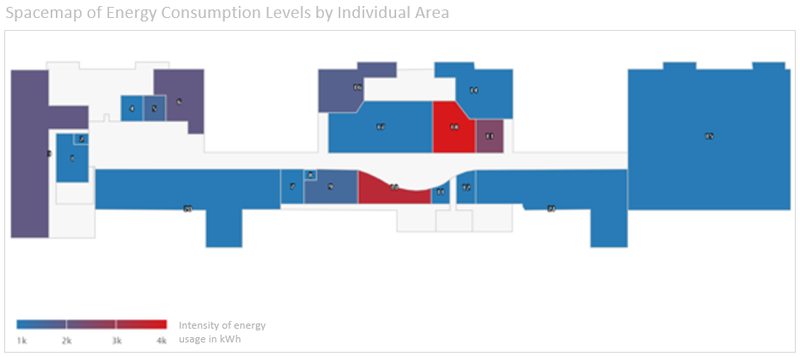
However, while the aforementioned chart options work well for energy managers and sustainability professionals, they are not always perfectly suited for facility managers, occupiers or “mere mortals”, aka the rest of us. In addition, when it comes to spatial analysis of consumption patterns in relation to utilisation or occupancy metrics in large and complex buildings, a Spacemap sometimes says more than a thousand bar charts.
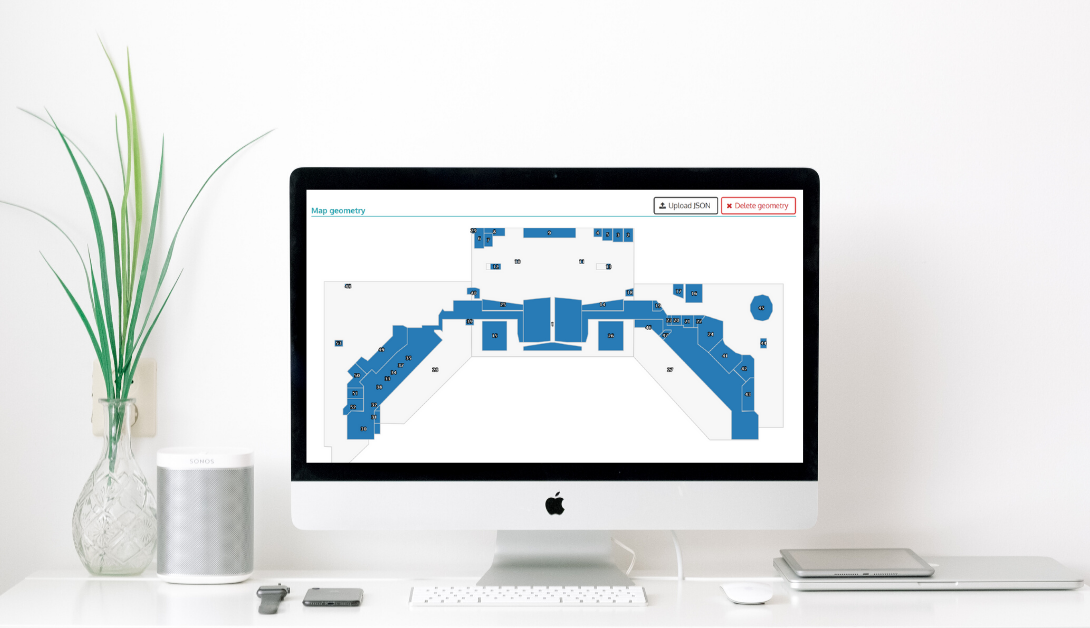
Spacemaps are based on two-dimensional representations of asset layouts (essentially floorplans) with user-defined granularity. Our platform allows for the generation of heatmaps on top of the floorplans, by color-coding of individual areas based on specific metrics from energy consumption to alerts, making the data much easier to absorb for expert users and non-experts alike.
So with this new module, we’re adding a crucial level of visualisation to the analytical capabilities of Fabriq OS: Location.
By tying key building performance data and related alerts to the specific location in the building, it opens a wealth of opportunities for understanding what happens in the building and where.
A facility manager can use Spacemaps to identify area usage over time, tapping into potential energy consumption savings based on utilisation; an office manager can immediately connect an alert about problematic air quality to the exact area and take action accordingly; or tenants can locate productive meeting spaces with low staff density and good air quality on digital screens in public spaces of a building - just to name a few possible use cases.
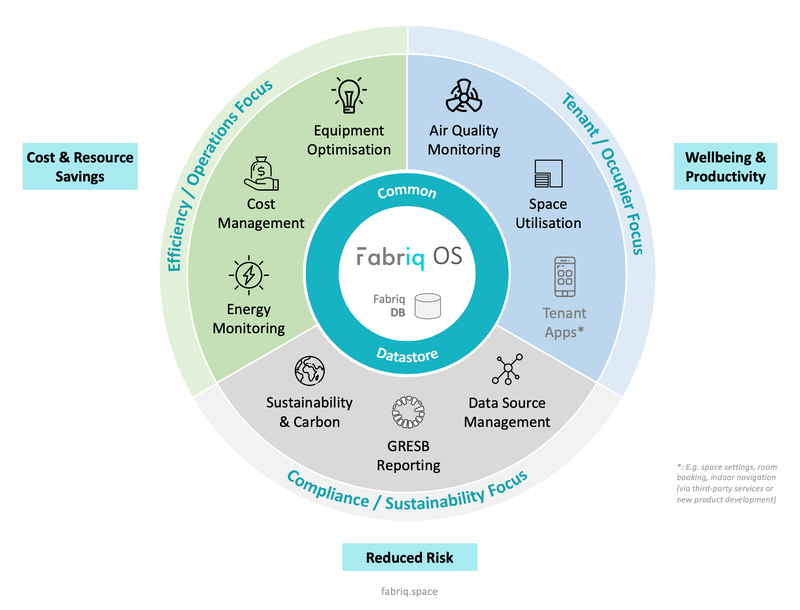
Closing The Loop (Or Wheel, As It Were)
For us, Spacemaps really play a key role in connecting the “backend” of operational building management, i.e. data collection, validation and analysis, with the “frontend” in the sense of the end users in the building. Fabriq OS tracks and analyses nearly any type of quantifiable data that comes out of buildings and spacemaps can serve as the missing link between our core customers like facility managers and building operators on the one hand and tenants on the other.
Download the Spacemaps brochure if you would like to find out more about the Spacemaps module or learn how it works in detail or contact us directly.
In this context, we love working in partnership with other system providers. Integrations with room booking, indoor navigation or people counting apps can fully close the loop and realise an end-to-end offering for a wide range of stakeholders. If you’re out there looking for new opportunities, do get in touch and let’s explore how we can turn buildings into better places for everyone, together.