
Demystifying Degree Days and How to Use Them to Improve Your Energy Analysis
Share This Blog

Degree days are the most underused performance metrics in energy data analysis. Simultaneously, they are widely misunderstood and therefore misused.
Weather conditions are the most influential factor when it comes to the variability of energy use in buildings. Even in a moderate climate such as the UK’s, changes in the requirement for heating and cooling typically accounts for 50%-70% of the variation in usage over the course of a typical year. In other words, regardless of everything else that’s going on inside or outside our buildings, changes in weather account for nearly all fluctuations we see day to day, week to week or month to month.
If you’re not going to use degree days for your energy data analysis, then you may as well be blindfolded. It would be like going on a diet but not tracking how much you eat.
How degree days are calculated isn’t actually that important. What’s important, is that you understand a degree day simply indicates how much heating or cooling is required in a given period of time in a particular geographic location. They come in two forms, heating degree days (HDD) for heating and cooling degree days (CDD) for cooling. The unit of a ‘degree day’ doesn’t actually mean that much, and it doesn’t have to. Just think of it as ‘the amount of heating or cooling required’.
For those that want to know. A heating degree day is calculated by subtracting the average daily temperature in a given location from your chosen base temperature (we’ll cover base temperatures in a moment), multiplied by the number of days. A cooling degree day is calculated by doing the opposite, subtracting the base temperature from the average daily temperature, multiplied by the number of days.
HDD = base temperature - average daily temperature * number of days
CDD = average temperature - base temperature * number of days
Oh, and you can’t have negative values. If it’s less than zero, it’s just zero.
So if the average temperature on the 9th of April in London was 12°C and you used a base temperature of 15.5, that’s 3.5 heating degree days and 0 cooling degree days. If on the 22nd of June the average temperature was 20°C, that’s 0 heating degree days and 4.5 cooling degree days. You can find some more scientific explanations online if that sort of thing gets you going but we’ll leave it there for now.
Why do I need to use degree days? Can’t I just use outside air temperature?
Unfortunately, no. It would be far easier to explain, for sure, but it has a fundamental flaw. Around March/April, in the UK at least, you probably switched your heating off for the summer. In other words, you’ve set your heating base temperature. The temperature at which you no longer require heating. This typically happens when the average daily temperature is around 15.5°C. It doesn’t matter how much temperature fluctuates above this point, it will not influence your homes energy consumption. Once again, the opposite is true for cooling degree days.
Try not to get too caught up in base temperatures. Just consider at which temperature you might need to start heating or cooling. For example, a very well insulated new build home might have a slightly lower base temperature for heating because it doesn’t need to heat until the average daily temperature drops below 13°C. A building made mostly of glass might have a lower cooling base temperature as it would take on a lot of heat from solar gains and would, therefore, need to start cooling earlier in the year when average daily temperatures reach 12°C.
Where do degree days come from?
In reality, anybody can calculate degree days but it’s probably not a good use of your time. Instead, you can download degree days for free from degreedays.net. They calculate degree days on a daily basis for almost all weather stations across the world. The only drawback is that you have to do this one site, or location, at a time, which can be quite tedious. They do have a desktop application but I haven’t had much luck with that in the past.
The good news is they’ve built an API which allows energy analytics platforms to automatically pull vast quantities of data and provide their customers with historic degree day information for their portfolio of buildings on a daily basis. If your current energy analytics platform doesn’t provide you with degree day data for your buildings and enable you to use them for analysis at no extra cost then it might be time to look elsewhere….
Stop dividing consumption by degree days
When using degree days for energy analysis, the common mistake people make is simply dividing one by the other, to achieve kWh/DD (energy consumption per degree day). It’s not that this is completely useless, perhaps it’s better than not using degree days at all, but it ignores an important point.
Energy use in buildings can be split into two categories, base-load and variable-load. Base-load relates to energy use that must occur for the building to function; security systems, server rooms, refrigeration, main area lighting etc. Variable-load is what’s driven by a long list of energy drivers which are often specific to the type of business that occupies the building. This could relate to the number of covers in a restaurant, footfall in a retail environment or production output in manufacturing, but most importantly, weather. We’ve already covered that in most buildings, 50-70% of this can be explained by changes in heating and cooling demand caused by weather.
Why is this important? Base-loads can vary substantially from building to building. A data centre’s base-load could account for 98% of its usage, only varying slightly in extreme hot and cold conditions or when its capacity is increased. A retail store will have a reasonably low base-load with a lot of additional variability driven by fluctuations in footfall and of course, heating and cooling demand, throughout the year.
The point I’m trying to make is that if you are going to divide by degree days, you need to isolate the consumption that is responsive to heating and cooling demand and ignore the rest. So how do we do that?
Linear regression analysis
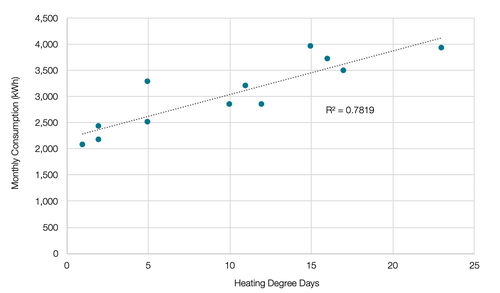
Not only do you get to impress your boss or client by saying “you’ve run the data through a linear regression model” but this approach is incredibly useful for understanding building performance. It’s where the true value of degree day analysis lies. In very simple terms, it’s a scatter plot with degree days on the x-axis and consumption on the y-axis, with a trend line thrown in for good measure. You should get something like this.
Linear regression analysis produces three core metrics that tell you all you need to know about your building. The full extent of what these metrics can be used for could be a blog in itself, perhaps it will be, but for now, I’ll try to provide an overview that should be enough for you to start generating some ideas for your own analysis.
The Intercept
In statistics, this is the point at which the trend line ‘intercepts’ your y-axis. In the world of energy efficiency and building performance, it’s your base-load, the usage that occurs regardless of external drivers. In this example, it’s somewhere between 2,000 and 2,500 kWh. So that’s approximately 2,250 kWh of usage a month allocated to base-load.
Multiply your intercept by 12 and work out what proportion of your annual usage it accounts for. Is it what you expected? If it’s much higher than you anticipated it could be that your heating or cooling system is running flat out and actually makes up part of your base-load.
Divide your intercept by the floor area of each building and analyse this metric across your portfolio. Is there a reason why some sites have a much higher intercept per m2 than others? How significant is the spread? Can you explain or justify the outliers?
R2 value
This value explains how well correlated your data points are, or how strong the relationship if between the two variables. In the example above, approximately 78% of the variation can be explained by degree days. A perfect correlation (R2 score of 1) would be every data point sat on the trend line. The space between the data point and the trend line is the other influential factors at work. If they are particularly influential, this will lower your R2 score. Anything below 0.7 and you’ll need to reconsider using degree days as there is too much external noise.
You can also easily identify any anomalous months and dig into those a little deeper. Is there a reason why they don’t follow the general trend? What else is influencing energy consumption?
A strong correlation is not a badge of honour! There could be other factors such as the business metrics we covered earlier that should be influencing usage, but aren’t. An example would be an office with highly variable occupancy that heats and cools the space regardless of how many people are in the building. If this building used a more efficient demand-based control strategy, the R2 may be weaker but the building is more efficient.
Slope
The steepness of your trendline indicates how responsive your building is to fluctuations in degree days. The steeper the line, the more responsive. This statistic has the potential to tell you so much about your building. Understanding why some seemingly similar buildings have different slope values can uncover substantial energy-saving opportunities.
Let’s revisit our restaurant example. You might want to segment your portfolio into building types; shopping centre, new build, listed buildings etc. Are there clear differences in the slope between building type segments? Are there any outliers? A less efficient building might have a more severe slope.
A personal favourite technique that can be used for all three metrics is to analyse change over time. Create a rolling 12-month calculation of intercept, R2 and slope, then try to identify both gradual and step changes. Is there a point at which your intercept increased for no apparent reason? Has your slope steadily increased over the past couple of years indicating your building is becoming more responsive to changes in weather? Why?
The importance of Context
Energy consumption data alone doesn’t provide you with enough information to make informed decisions, you need context. To re-use the dieting analogy, tracking energy usage is the equivalent to measuring your weight. You know it’s changing but you don’t know why. Degree day data is your caloric intake from meals or your calories burned during exercise. It helps you understand what’s causing the change.
The problem is, building performance variables and business metrics are incredibly difficult to get hold of. You’ll no doubt face data privacy issues, the data itself will be incomplete or the resolution isn’t granular enough. Or more commonly, they’re metric you need isn’t being measured at all. You plan to add sensors and additional monitoring technology but it’s far too expensive and you can’t form a concrete return on investment.
The beauty of degree day data is that it’s so universal, widely available and incredibly reliable. You can go back years, decades in fact, and assess changes in performance over time. What other metric allows you to do that?
I’d like to hear what other uses you have found for degree day data. You can find me on Linkedin or get in touch by email at jon@fabriq.space