
Calling all project managers: new & improved Projects module in Fabriq
Share This Blog

Since we launched Fabriq (then EnergyDeck) way back when in 2012, we have been on a mission to democratise access not only to building performance data, but also 'projects' such as resource savings measures. We did this in order to enable our users to learn from each other, easily share best practices and ultimately run better / more efficient / comfortable / healthy etc. buildings.
While the functionality of the initial Projects module has been improved over the years, its look & feel and workflow has not really kept pace with the other updates we've made to the platform in the meantime, especially during the recent relaunch.
That has now changed. Please welcome the new & improved Projects module, which is already accessible to all Pro and Enterprise users of the Fabriq platform.
Project Summary - better looking, with more useful info
The first thing you'll notice when you see the new version of Projects is that you actually *see* something straight away :). You see, the drawback of the previous version was that you were greeted with a largely empty screen at first, and then had to select sites to see the respective project data. That worked OK if you had only a handful of sites and knew which of them had any projects. But the user experience for large portfolios with maybe hundreds of projects was certainly suboptimal, to say the least.
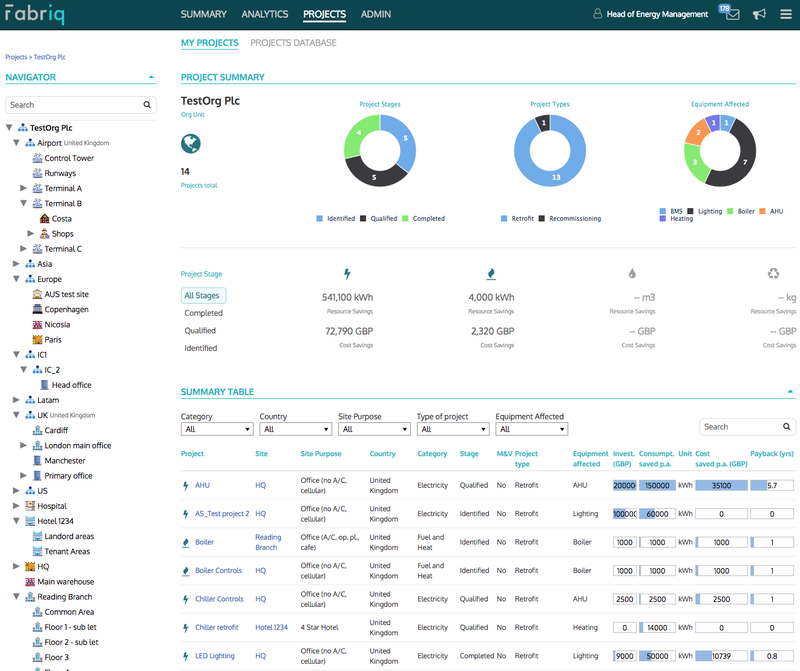
As of today (ok, last week), you will instantly see *all* your projects at a glance when you navigate to the Projects module. Not only that, but you'll also get much more information than previously. This includes:
- Project status by implementation stage - ie identified, qualified, completed
- Summary of project types - eg retrofit, recommissioning, etc.
- Summary of type of equipment affected - eg heating, cooling, lighting, AHU, BMS and so on
In addition, you will now find a top-level summary that shows the impact achieved by your projects at the various stages of implementation (all, completed, qualified, identified) and key resources (electricity, gas, water and waste).
This works at global, organisation and site level - you always get the same type of information (status summary, impact summary and project list - see below), adjusted to the organisational level you're viewing this from.
Project Lists - easily find and navigate to your projects
Underneath the summary, you will find a new Summary Table that has information about the various projects that exist at the chosen organisational level.
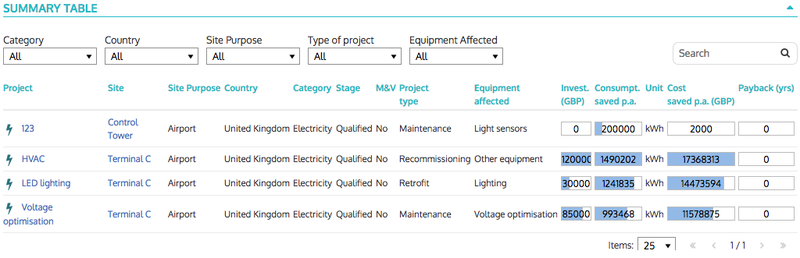
This table isn't too dissimilar to the one you saw previously, but it comes with some useful upgrades:
- Options for filtering projects by e.g. category, country, site purpose etc at global level
- A search box (yay search!)
- More information in the table rows about the individual project performance, including whether it has been automatically validated by our super duper M&V capability
- Formatting updates to make sure this section plays well with the rest of the platform
Again, you'll find this same upgraded functionality at organisation and any site level.
M&V - automatically assess the impact of your savings measures
While M&V - short for measurement and verification - capability has been available in Fabriq for some time now, a recap might be in order since a) we never really announced it to the world when it launched (typical... don't get me started) and b) it works very well with the new Projects functionality.
Here's how you can try it out for yourself:
- In the Projects module, click on any project you have created (e.g. similar to AHU in the top row of the table example shown above)
- You will be taken to the Project Summary that shows the project details.
- Click on Edit Project (button in top right corner); this will make the lower part of the screen editable (see below - chart a)
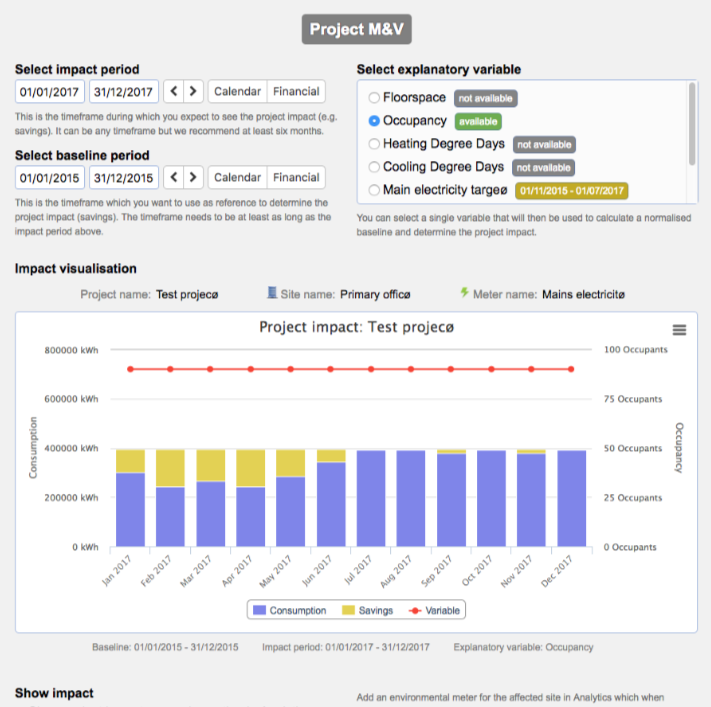
- In the Edit Project form, click on the blue tab labeled 'Qualified (Project M&V)' and then click the big blue Auto Validation button. This takes you to the M&V screen (see below - chart b)
- Here you can set your baseline period, the impact period and pick your explanatory variable from the list of environmental variables available for the selected site and meter. The project impact will be automatically calculated and dynamically updated based on your selections. You can also choose to make the project impact (e.g. savings) visible as an overlay in Analytics.
Voila - all done!
Chart (a) Project details - editing mode
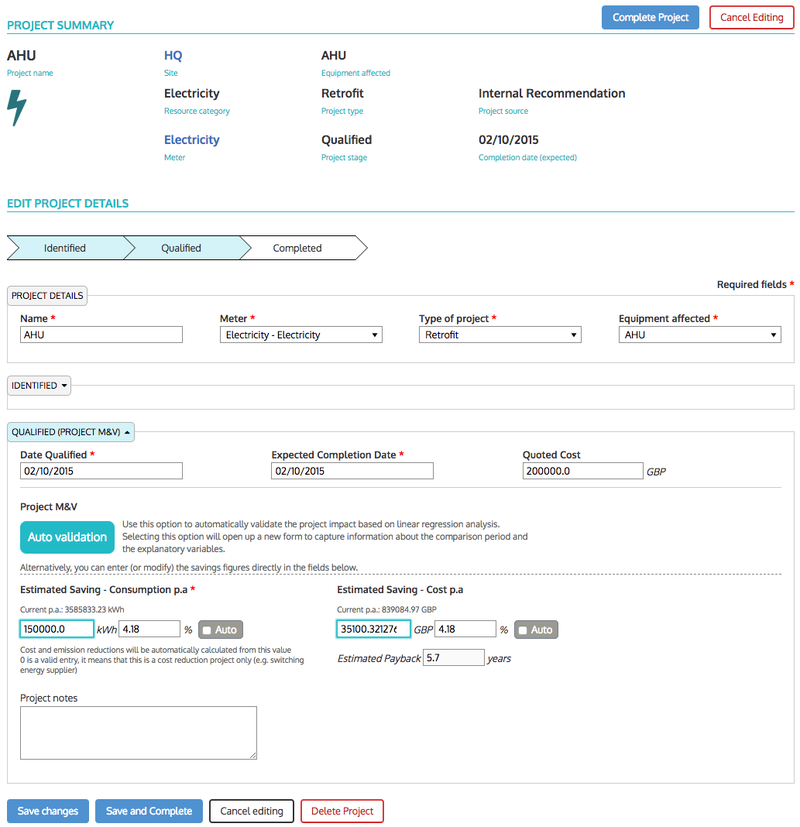
Chart (b) M&V screen - dynamic calculation of project impact with automatic normalisation
That's it for today. Oh wait, one last thing -
Any feedback, questions, suggestions - you know where to find us!