
A 4 Step Process to Identifying Non-Operational Waste and the Most Cost-Effective Energy Savings You’ll Ever Make.
Share This Blog

Last week I shared a blog post about why I believe energy waste during non-operational hours is one of the most easily avoided forms of waste in buildings. This week, I’m deep-diving into the 4 step process to identifying energy waste during non-operational hours across your portfolio of buildings.
I spent many years working as an energy analyst for multisite portfolio’s of commercial buildings and used this approach time and time again. In fact, it was always the very first thing I would do. Even before a customer came onboard I’d run the analysis and determine how much of a benefit they could expect to see from a remote-based energy monitoring service. In almost every single circumstance there was a huge opportunity.
This may seem like a lot of work but trust me it’s worth it. If you’re only interested in tracking building performance on a monthly basis then this might not be for you…..
Step 1 - Find your achievable baseload
A buildings achievable baseload is a level of overnight usage that you determine it can reach under normal circumstances throughout the year.
This can be done quantitatively (or using a top-down approach) through analysis of the half-hourly consumption data. Ideally, you would have at least a year's worth of half-hourly data but use whatever you have available. The aim is to identify a cluster of the lowest half-hourly intervals, ignoring any anomalies that occurred due to power down’s or other one-off isolated events.
Depending on the number of buildings in your portfolio, you may want to apply consistent logic in a model to save some time. However, I’d advise always starting manually and build your model based on your initial observations. Continue to check the output of your calculation, particularly the outliers that don’t follow the trend.
It is sensible to err on the side of caution. You can do this by averaging out of hours consumption for a day and finding the lowest days over a year, this should help to avoid anomalies that occur when isolating half-hourly intervals. Your energy analytics platform should allow you to do this or it can be done in a spreadsheet tool like Microsoft Excel.
It’s important to experiment and try different models until you have something that looks reasonable for all of your buildings. Analysing the data graphically can help to double-check your achieved baseload is not overly ambitious. This is a very worthwhile exercise as it will illustrate the variability of your baseload.
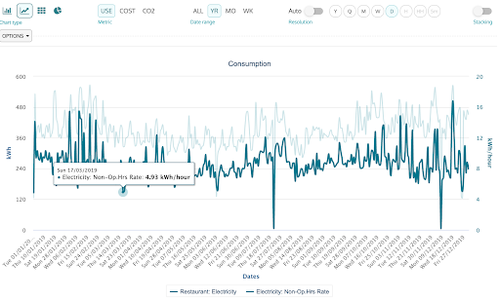
The example below clearly shows an achievable baseload of 5 kW but shows variability as high as 16 kW on some days. Additionally, you can see non-operational load increases when heating and cooling demand is at its highest during the winter and the peak of summer. Unfortunately, this is a very common sight. I can almost guarantee you’ll have several buildings like this in your portfolio. The non-operational line should be completely flat except for known events such as maintenance work taking place overnight.
Step 2 - Estimate your optimum baseload
A building’s optimum baseload is the level of overnight usage that can be reached if all non-essential equipment is switched off and consumes 0 kWh.
This approach varies in feasibility depending on the complexity of your building services. However, it doesn’t have to be an exact science. It is possible to make estimations and use assumptions providing you take them into consideration later in the process.
In order to find your optimum baseload, combine the kW rating of all your essential building services and multiply by the number of non-operational hours in a typical week. In a smaller building, such as a restaurant or high street bank, this will be fairly straightforward. In more complex buildings take account of the main building services and then allow some room for anything you’ve missed.
If you are dealing with a large portfolio of buildings, use samples that represent all building types in your portfolio and extrapolate out the results of your analysis. For example, a building with security lighting might use 0.2 kW per square meter during non-operational hours.
Another approach is to compare achievable baseload across similar building. If you have a group of say 10 similar buildings, you can use the lowest achieved baseload in the group as the optimal for all 10.
However, be cautious when taking this approach and ensure there is no reason why some buildings may justify a high non-operational load. But if you know your buildings well and are confident there is no reason why one building should be using more than another, this can be a great way to identify waste.
In the situation that you have consistently accurate sub-meter data, this step is far simpler. Analyse the data and determine what should be running out of hours and what should be switching off.
Step 3 - Calculate wasted energy
You’ve done the hard work. Now it’s time to assess how well your buildings are performing against the two baseloads. The relevance of each value will become apparent in step 4 but for now, think of them as a best and worst case, or an ambitious target and a conservative one.
As operational schedules usually work on weekly cycles, this is the lowest resolution you should use for calculating non-operational waste. Anything on a daily basis has the potential to cause confusion as it’s very likely the number of non-operational hours will vary greatly from day-to-day or weekdays to weekends.
Calculate how much energy has been used during non-operational hours by summing the consumption during those hours for each day over the course of a year, of whatever period of data you have available. Then, calculate the achievable and optimum usage during the same period, using the values from step 1 and 2, and subtract from the total non-operational usage.
It’s important to do this over a year if possible as seasonality is often a significant factor. A calculation based on a week in winter could substantially overestimate the savings on offer.
Total non-operational consumption - (achievable baseload * non-operational hours) = waste
As an example:
- Total consumption during non-operational hours in 2019 = 29,700 kWh
- Achievable baseload of 5kW at 84 non-operational hours per week = 420 kWh
- 420 kWh per week multiplied out to a year = 21,840
- 29,700 - 21,840 = 7,860 kWh of wasted energy during non operational hours in 2019
You should repeat the process using your optimal baseload.
Step 4 - Communicate your findings
The last and undoubtedly the most important part of the process is to communicate the findings of your analysis. This is where analysts and energy managers often fall short. They suffer from what’s known as the ‘curse of knowledge’ and jump straight to presenting solutions to minimise waste. It’s important to fully illustrate the extent of the wasted energy so that decision-makers understand the opportunity in front of them. Additionally, previous experience can mean they jump to conclusions before properly interpreting the data to understand what’s really going on.
In my last post, I talked about the ‘controls fallacy’, where building managers don’t want to believe that their building is using excessive energy when it’s unoccupied. Therefore time and effort spent fully explaining the current situation will streamline the process as all stakeholders understand why your proposal needs to be implemented as soon as possible.
The differentiation between the Achieved baseload and the Optimal baseload comes into play when communicating the opportunity to reduce energy consumption. When business owners are presented with energy conservation measures that will save them x%, their usual response is understandably “Prove it !”.
Presenting the opportunity to save energy based on the achieved baseload should alleviate some of these concerns. Your message should be to suggest that there is no logical reason why this level of usage can not be achieved all year round during non-operational hours. It’s not very common that you have this luxury so use it to its full extent.
Present the savings on offer and the associated energy conservation measures with urgency. The main priority should be to get the building performing to the level its capable of on a consistent basis as soon as possible. It would appear it already has the capability to do so which suggests costs should be relatively low.
As useful as the achieved base load is, it’s far from perfect. The word achieved has been chosen carefully. It suggests potential but there is no implication it is ideal. There’s every chance this building has failed to shut down properly ever since it opened. This is where the optimal baseload comes in. The comparison between achieved and optimum baseload alone is often enough to raise concerns.
If there is a significant difference between your achieved and your optimal baseload, which is frequently the case, you could have a serious controls issue. This is suggesting that your building has never shut down effectively. Energy waste is likely to be substantial.
The savings on offer from your optimal base load is a more difficult message to deliver. It should be more of a long term objective once the achieved baseload has been maintained. There’s a good chance additional controls equipment will be required to maintain that level of non-operational usage day after day.
The key to communicating your message effectively is collaboration. You have to bear in mind that by identifying waste, you are essentially highlighting that someone isn’t doing their job. This same person is often an important part of the process and can kill if they feel their ability is being questioned.
My advice would be to involve your customer or stakeholder in the analysis process and then brainstorm ideas together. If you can pinpoint a number of recent occasions when non-operational consumption reached the achieved baseload, investigate what might have happened on that day to make it possible. Did a particular person shut down? Did anybody reconfigure the HVAC controls? Christmas and bank holidays can be an excellent time to compare to as there’s often a more concerted effort to fully shut down a building.
By doing this you’ll not only have the benefit of their building-specific expertise but you’ll also have their buy-in and support.
I’d strongly recommended you try this approach out across your portfolio of buildings. If you have any questions or would like some guidance on how to carry out the steps above, please feel free to drop me a message on Linkedin or by email: jon@fabriq.space