

New Year, New Challenge

Fabriq team members pushed themselves out of their respective comfort zones. Forget Veganuary! Team Fabriq challenged itself to complete a minimum of 7,500 steps by the end of the month. Quite fitting really, with the 2020 Olympics scheduled for later in the year.
"And why, why would team Fabriq plunge itself into this challenge?" I hear you ask. Well, as a famous celebrity once said "because we want to" but also the challenge served the purpose of emphasising general health and well-being and simply enjoying the outdoors more, in 2020. Oh, if you recognise the last quote, then you are wise beyond your years.
So what exactly do 7,500 steps a day look like? By all accounts this constitutes a daily commute, from home to the office and back again with a smattering of walks to the local shops for lunch and a healthy dose of half hourly breaks away from the desk. Participating team members were split between two sites: Kiev and London; of course working towards a common goal but there was definitely added spice to the challenge. Would one site put in more steps than the other?
Step Count Results
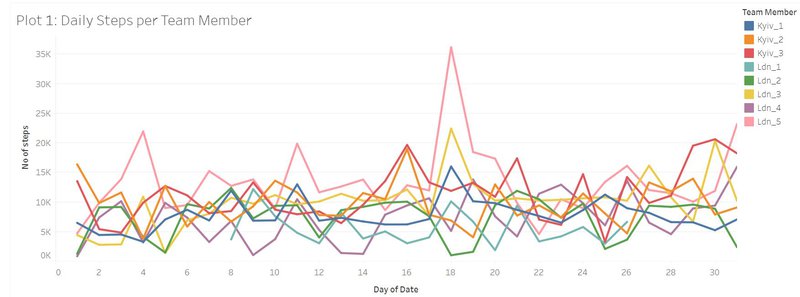
Have a look at Plot 1. Confused? Not surprised. Charting the daily steps per team member is an initial attempt at making sense of the underlying data and although admirable, the entanglement of lines falls a little short in delivering a coherent message; especially, since the results are anonymised in avoidance of recriminations and finger-pointing (as if!). Apart from a few anomalous peaks, very little can be gleaned from the chart. It is difficult to tell if the team met its target. However, to a dataphile (did I just invent a new word?), this is a visual treasure trove of insights into team members' lives. By asking the right question and calculating summary statistics, we can begin to infer the activities of team members.
Questions, Questions!
Did the team achieve the daily target?
Who was stuck indoors instead of enjoying the fresh air of the great outdoors?
Which team member was busy sleeping while the others were active?
Who was punching above their weight?
Which team performed the best?
Individual performance by location
Moving on to the plots 2&3, which show the daily step counts of team members in Kiev and London respectively, the old adage of 'less is more' rings true. While there are less lines on display, the quality of information dramatically improves. In a nutshell: With only three participating team members, the Kiev team appears to be clocking more steps than the London team, comprising five participating team members. Well, that is one shocking revelation and warrants a 'scream' emoji. However, there is redemption for the London team represented by the line showing the average number of steps, which is reassuringly above the expected daily step count of 7,500. Yay! We met our daily average.
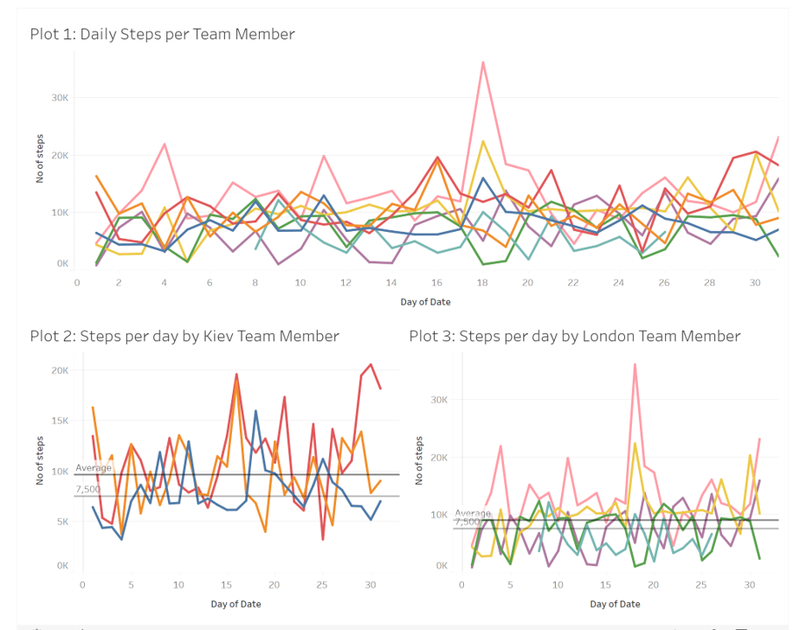
There is definitely more tea to spill, so keep reading!
Using Summary Statistics
The charts below take at the weekly average statistics, a slightly different perspective from the charts above; I say average statistics because the top plot, plot 4, focuses the analysis on the common mean and the bottom plot, plot 5, focuses on the median. The top plot uses basic normalisation techniques to account for the differences in the number of participating team members across the two sites, Kiev and London and it is still very much apparent that the Kiev team averaged a little more each week than the London team but more succinctly stated than the charts above. A common feature seen across both locations is the slow start in week one. I do not believe that exercise was on anyone's mind so close to Christmas; digesting turkey leftovers, Brussels sprouts and mince pies - hopefully not all at the same time - is quite taxing after all.
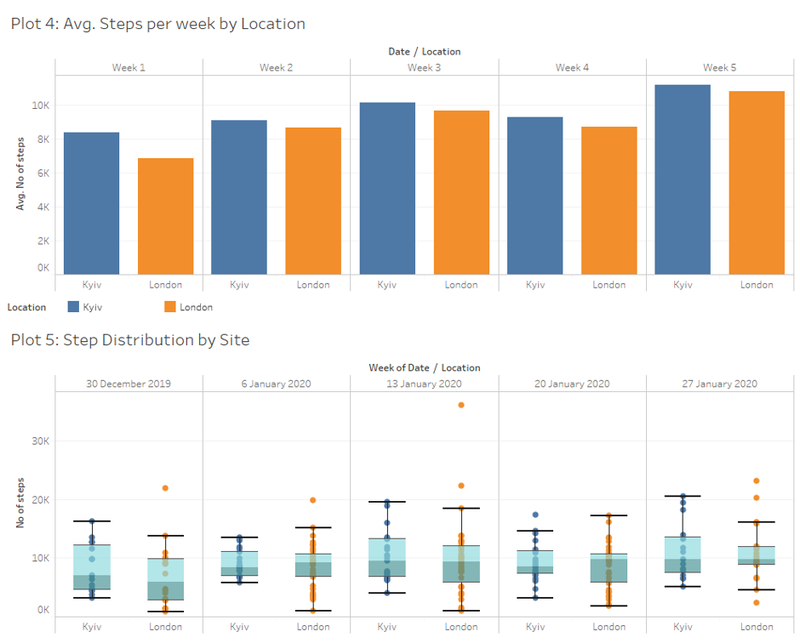
Finally, Plot 5 shows a weekly comparison of the distribution of step counts, centred around the median. The median is another average but the one difference is that it mitigates the effect of outliers. The other useful feature of plot 5 is the detection of outliers as can be seen in the first three weeks of the month and also in the final week, by the London team! Not all step counts are equal.
There appears to be at least one, if not several, over-zealous members in the London team, who registered unusual activity levels in the first three weeks of the month. There were several 20,000+ step counts and a peak count of over 36,000+ daily steps during week three! Such behaviour drew the attention of colleagues and on further examination, one individual crumbled under the scrutiny of interrogation and confessed to notching up extra steps in the gym. Team members were henceforth reminded that the idea of the challenge was to increase outdoor activity, so walking the dog, gardening, trail-run or even going to the supermarket without the car were acceptable activities; pounding the treadmill, although commendable did not meet the brief. Cheating or simply a lifestyle choice? You be the jury. Another member claimed that she walked several miles to the nearest shop! Wow. Interestingly London also registered some of the lowest step counts but the devil is in the detail. The variability could be explained not by lack of commitment but by the fact that some team members chose to work from home on many occasions and so could not benefit from the daily commute.
Final thoughts
A veritable pat on the back is in order for all those completing the challenge. Some of the locations shared by team members were exquisite - the Carpathian mountains, no less - look it up - which is a far cry from Paddington, Fabriq's current London location.
Speaking of location, here are some snaps from our January step count challenge.

p.s. All the charts can also be see here - We love beautiful data visualisations so much that we have our very own public Tableau account:-)